On-Orbit Mission Operations
On this page:
Science Data Collection
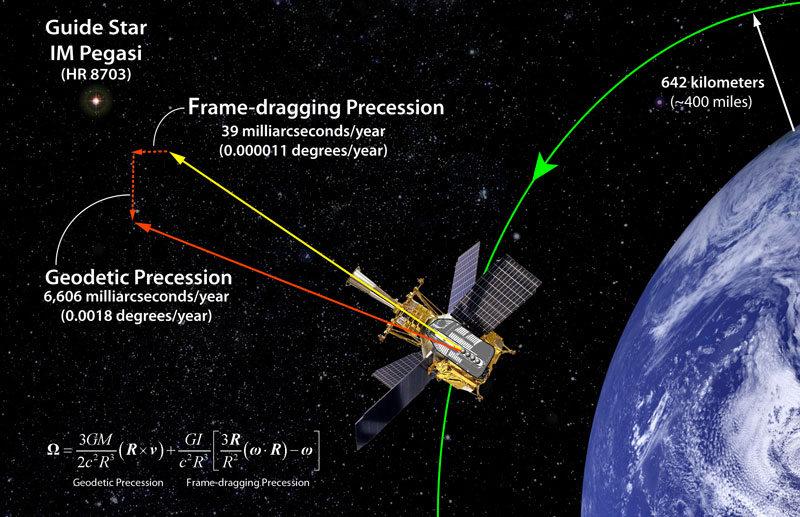
Composite image showing the
GP-B experimental measurements
The transition from the IOC phase to the Science Data Collection phase officially occurred on Mission Day #129 (27 August 2004), with gyros #1, #2, and #3 in science mode, and gyro #4 continuing to undergo alignment of its spin axis. Spin axis alignment of gyro #4 was completed two weeks later, on Mission Day #149 (16 September 2004), and it too then began collecting relativity data, along with the other three gyros.
Lockheed Martin Team Phase-out
An important shift in personnel took place when the IOC was completed. The Lockheed Martin team, which had supported the program as a very major contributor prior to launch, and as a co-contributor during IOC, phased out as IOC neared completion. Some of the subsystems, such as power, software, thermal, and others had been transitioned to Stanford personnel as IOC progressed. These systems were performing flawlessly, and required little or no commanding to maintain. The most challenging of the LM subsystems, the ATC system did require daily attention and very regular commanding. In this system, LM did remain on board with full-time support for a few months after the completion of IOC. In this very challenging system, Stanford was ramping up a 3-4 person team. Although the team members were young and less experienced than the LM team, their enthusiasm and capabilities of a Stanford Master’s degree were quickly recognized. In addition to their innate strengths, the IOC period had been an exceptional training ground for the team.
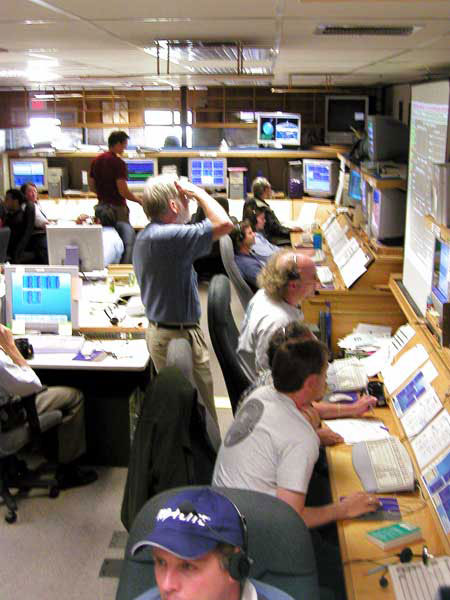
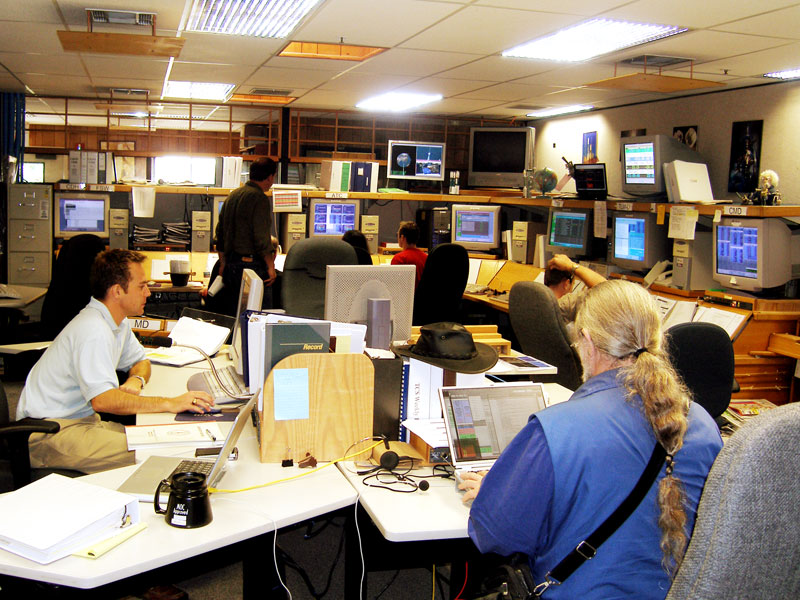
Routine Mission Operations Activities
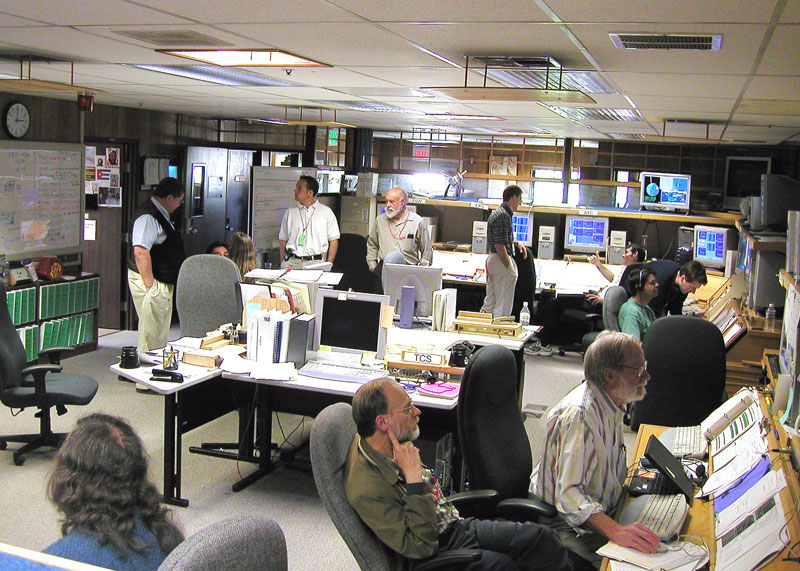
Monitoring spacecraft & payload
systems in the GP-B MOC
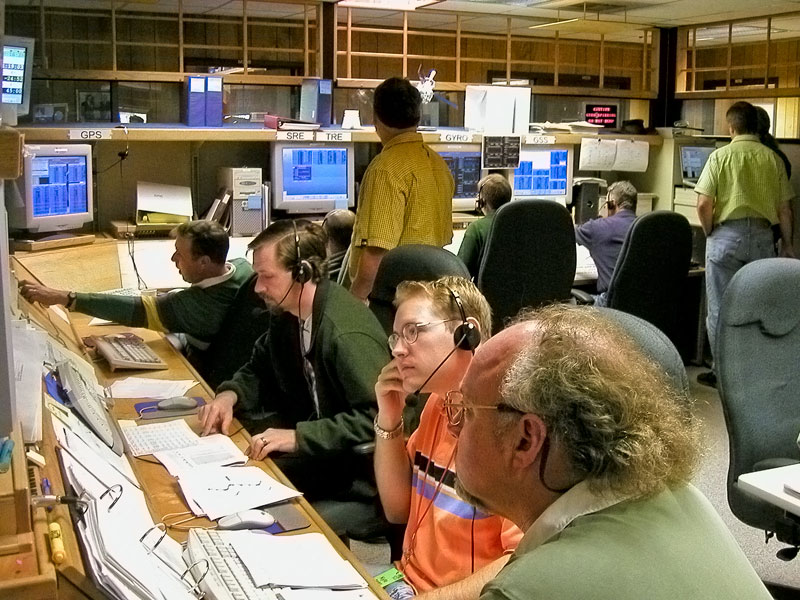
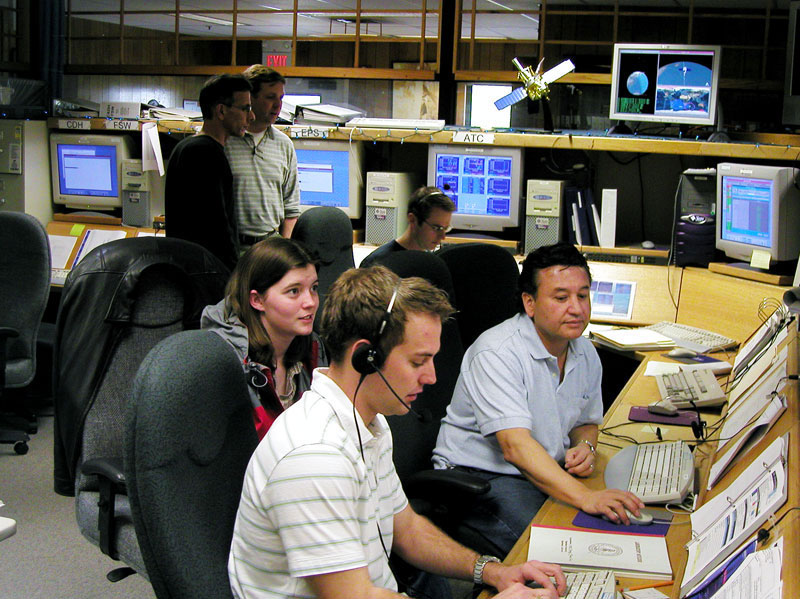
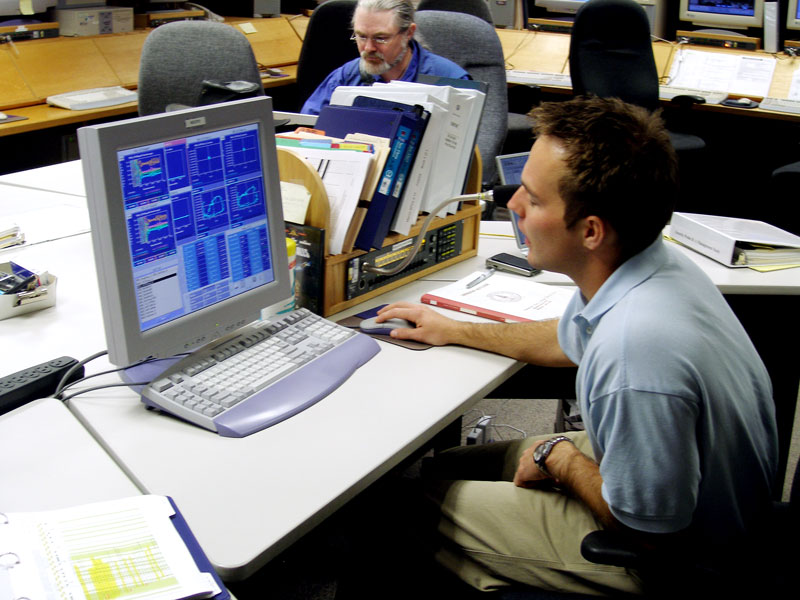
Working through an anomaly in
the MOC
In comparison to IOC, the Science Data Collection phase was relatively straightforward and routine. By the start of the Science phase, the team was very well trained; each team member knew well his or her responsibilities, thus further easing the effort. Moreover, while most days were uneventful, an “all-hands” meeting was held every day to ensure that the team remained focused on the status of the total system—spacecraft and payload. The all-important science data were transmitted to the ground four times a day. The engineering and science teams reviewed the data on a daily basis and provided top-level feedback on the previous day's data at the daily meeting.
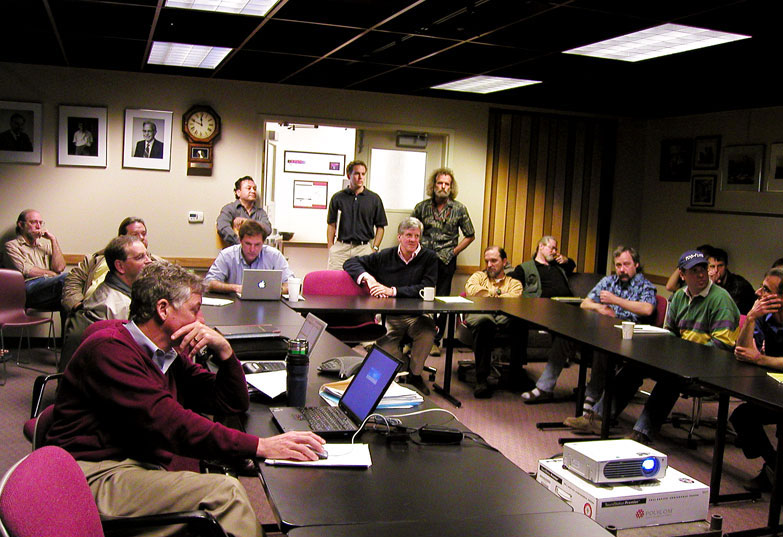
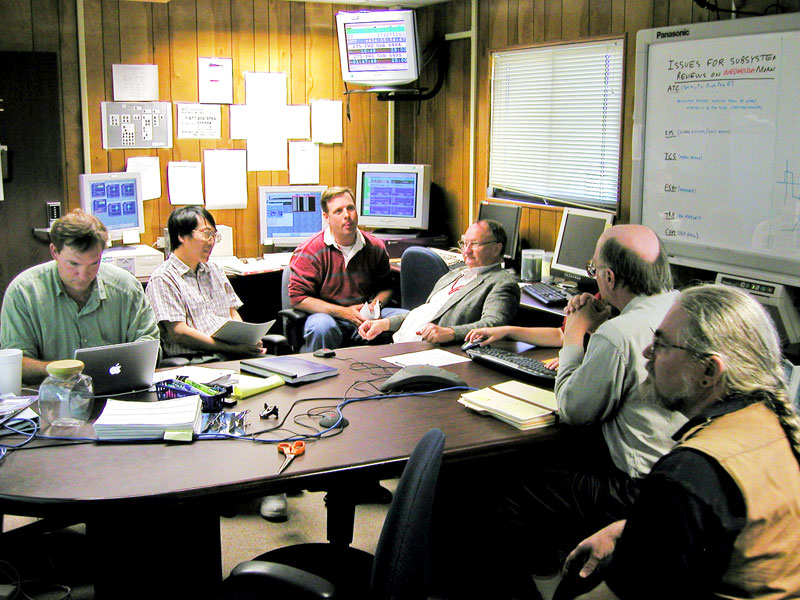
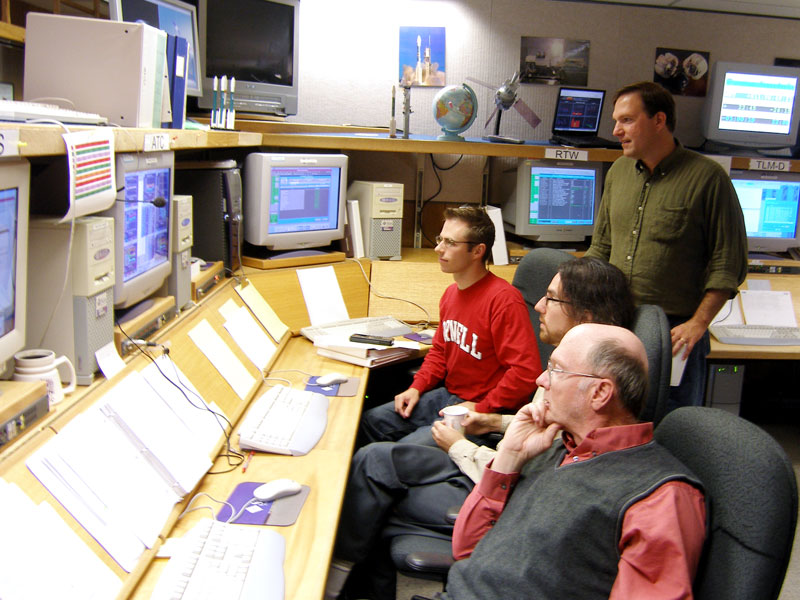
A typical daily all-hands
staff briefing
Ever since the launch of the spacecraft in April 2004, the Mission Operations Center (MOC) at Stanford was the lifeline to the spacecraft. Mission operations personnel in the MOC were always focused on the current vehicle status. Typically, the vehicle would be “green” and the MOC would verify this status with a real-time monitoring system. In a typical “green” day, the daily 10 am “all-hands” meeting would inform the team of the previous day's events and planned future operations. Following the all-hands meeting, mission planners would meet with subsystem specialists to develop the detailed plan for the next day. In practice, much of the planning already had been developed long before, and only rearrangement of the order of tasks was required. When new products were required, the Integrated Test Facility (ITF), a ground-based computerized model of all systems on-board the GP-B spacecraft, was used for verification prior to use on the vehicle.
Any significant deviation from “green” would immediately “trump” other program activities. An efficient electronic communication-information system allowed for rapid response. Telemetry information from the MOC, as well as information determined from off-line analysis, were in near-constant review. Deviations from a “green” or expected result would cause the immediate initiation of an in-house anomaly resolution process, described in the next section.
Resolving Anomalies & Managing Program Risks
In space missions, there are always some problematic events—both anticipated and unexpected. The GP-B mission was no exception. We call these surprising events “observations” and “anomalies.” An important part of the pre-launch preparation for the mission was to set up a formal anomaly review process, including procedures for assembling a quick-response anomaly team at any time—day or night—to work through the anomaly, determine the root cause, and come up with a procedure for addressing the issues and returning the spacecraft to nominal operating mode.
The Spacecraft's Tale
Following is the text of a GP-B Mission News story entitled “The Spacecraft’s Tale,” that was featured in our December 10, 2004 Weekly Status Update, posted on our GP-B Web site and sent out to our email subscriber list. This story describes an anomaly with the spacecraft’s GPS system that occurred over the South Atlantic Anomaly region of the Earth on December 4, 2004.
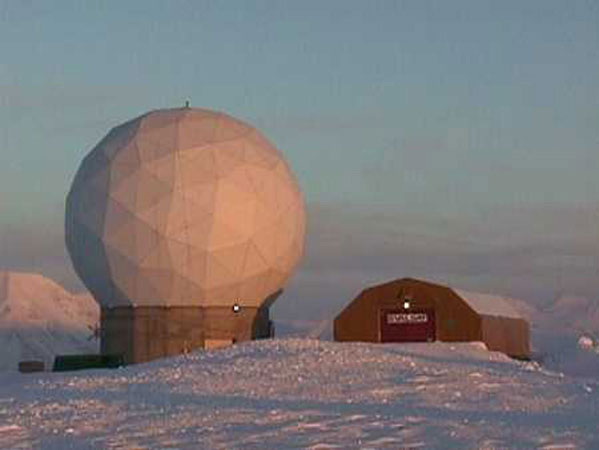
NASA ground station at Svalbard
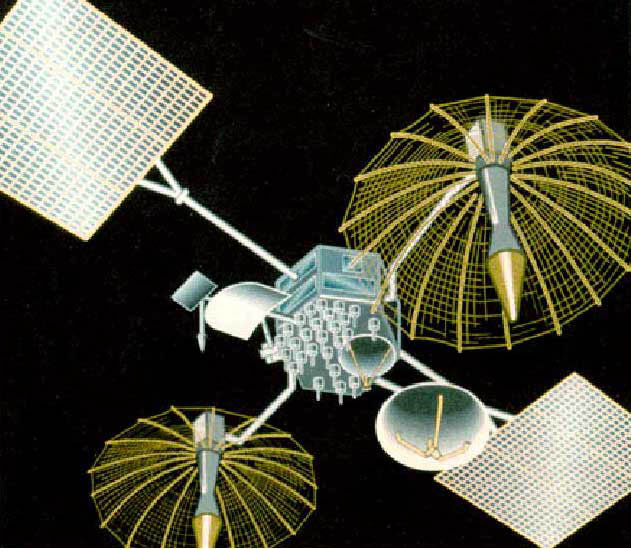
NASA TDRSS tracking satellite
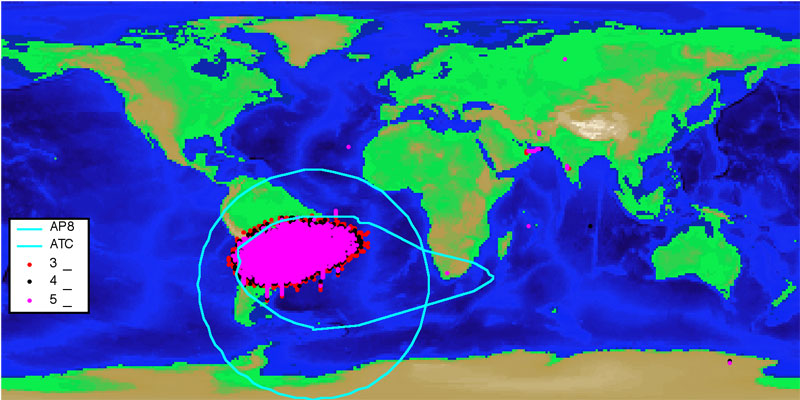
South Atlantic Anomaly area (pink)Last Saturday began as a rather “ho-hum” California winter’s day. Orbiting the Earth every 97.5 minutes, the GP-B spacecraft passed directly over California around 6:30AM PST, but the Sun was already up, and the sky was too bright to see the satellite. In the GP-B Mission Operations Center (MOC), a skeleton crew, consisting of the on-duty Mission and Flight directors and one or two resident engineers, monitored several telemetry passes (communications sessions) during the morning hours. Most were 25-minute satellite passes, during which the spacecraft relays status information to the MOC through the NASA TDRS (Tracking and Data Relay Satellite) communications satellite system. And, during a 12-minute ground pass at 1:15PM PST, the spacecraft’s solid-state recorder relayed relativity data to the GP-B science database through a high-speed telemetry connection with the Svalbard ground tracking station in Spitsbergen, Norway. All in all, it was a normal Saturday, and the atmosphere in the MOC was quite relaxed.
Following the successful ground pass with Svalbard, the spacecraft continued on its southward route. At around 1:30 PM PST, Pacific time, the spacecraft was flying over South America—heading towards the South Pole—when it entered the South Atlantic Anomaly (SAA). This is a region above the Earth where the fluxes of trapped protons and other particles, emitted by the Sun, are much greater than anywhere else on Earth, due to the asymmetry of the Earth’s protective Van Allen Radiation Belts. Thus, spacecraft are more vulnerable to being struck by protons when flying through this region.
At 1:48PM, Pacific Time, an odd event silently occurred on-board the spacecraft, triggering four safemodes (pre-programmed command sequences designed to automatically place the spacecraft, its gyros, telescope, and other systems and instruments, in a stable and safe configuration in response to anomalous or out-of-limits feedback from various on-board sensors).
There is a problem on-board....Back in the MOC, the next telemetry pass was not scheduled until 3:16 PM, so the operations staff was completely unaware of this change in the spacecraft’s condition—for the time being. At 3:15PM, the MOC staff settled into their seats for the upcoming satellite status telemetry pass. As the spacecraft’s antenna locked into the TDRSS satellite and began transmitting, one-by-one, status monitors around the MOC began turning red, signaling the spacecraft had triggered its safemodes. There is a problem on-board.
During the next 20 minutes, phones rang, pagers beeped, and soon, the MOC was teaming with activity. An assessment of the safemodes that were triggered indicated that an error—never seen before--had occurred in a module of the Attitude and Translation Control (ATC) computer system. The spacecraft’s GPS had registered an off-the-scale velocity spike, which if correct, indicated that, for one brief moment, the spacecraft had traveled faster than the speed of light—or to use Star Trek terminology, it had “warped into hyperspace.” In fact, the GPS system had reported a single data point with an erroneously high velocity, which when squared, caused a computer overflow. The ATC computer module took exception to this data overflow and triggered a safemode test, which in turn activated a chain reaction response sequence.
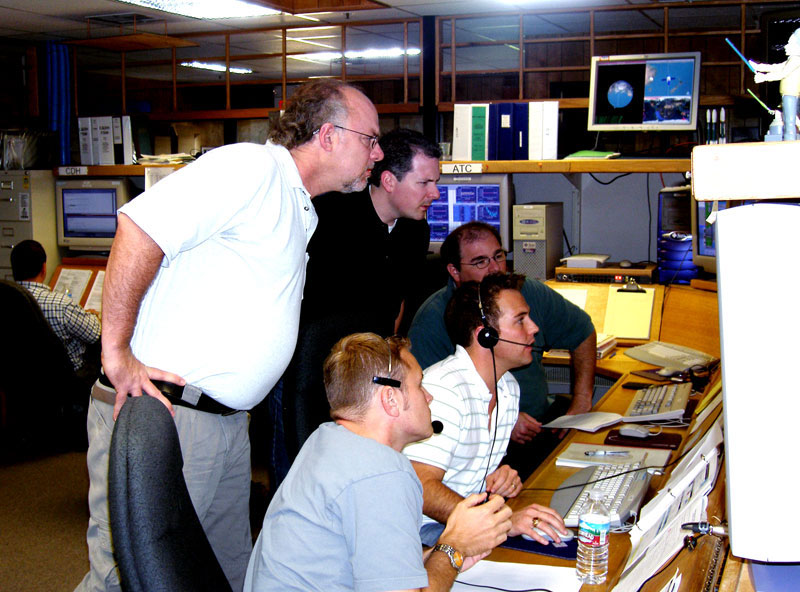
Anomaly resolution in the
GP-B Mission Ops CenterThe MOC staff immediately scheduled several extra satellite communication passes so they could communicate with the spacecraft more frequently. Then, over the ensuing 24 hours, they methodically worked through a series of tests and command sequences to return the spacecraft to its normal science operation mode. We initially assumed that the GPS receiver had suffered a proton hit in the SAA region, but further analysis suggests that this was not the case. Rather, this anomaly was apparently caused by one of the four accessible GPS satellites being in the wrong position for proper GPS triangulation. The ATC system usually catches situations of this kind and disallows the data; but, this one was out of range before the data reached the filter.
The spacecraft has returned to normal operations. This incident was not detrimental to the GP-B experimental data. And, once again, the fact that an anomalous event occurred while the spacecraft was flying through the SAA region appears to be a coincidence—or is it?
Reviewing and Resolving Anomalies
An anomaly resolution team in
action in the GP-B Anomaly Room
A special room in the GPB Mission Operations, called the Anomaly Room, was the home of the GPB Anomaly Review Board (ARB), a select group of senior GPB team members from Stanford, NASA, and Lockheed Martin, who managed the troubleshooting of anomalies and observations. The Anomaly Room, which was located across the corridor from the GPB MOC, contained a set of spacecraft status monitors, communications and teleconference equipment, computer and voice hookups, a documentation library, white boards, a computer projection system, and an oval discussion table.
During the flight mission, whenever an anomaly was in the process of being resolved, the Anomaly Room was staffed 24 hours a day, 7 days a week; at other times, it was staffed during normal working hours, with team members on call. When major anomalous events, such as computer reboots, occurred outside normal working hours, the Mission Director on duty activated the Anomaly Room and issued a series of pager and cell phone calls via computer, summoning key staff members on the ARB, along with a selected anomaly team, comprised of resident engineers and engineering specialists, to come in and work through the issue. The group used a technique called “fault tree analysis” to evaluate and determine the root cause of unexpected events.
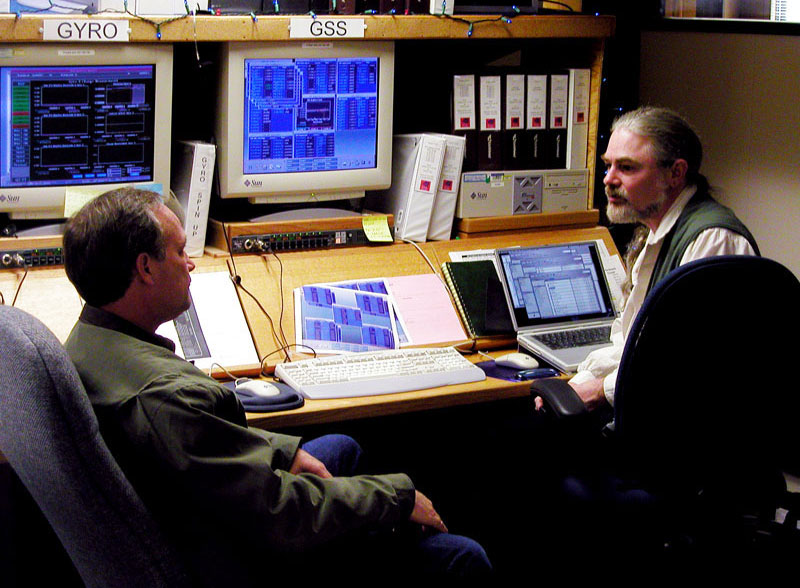
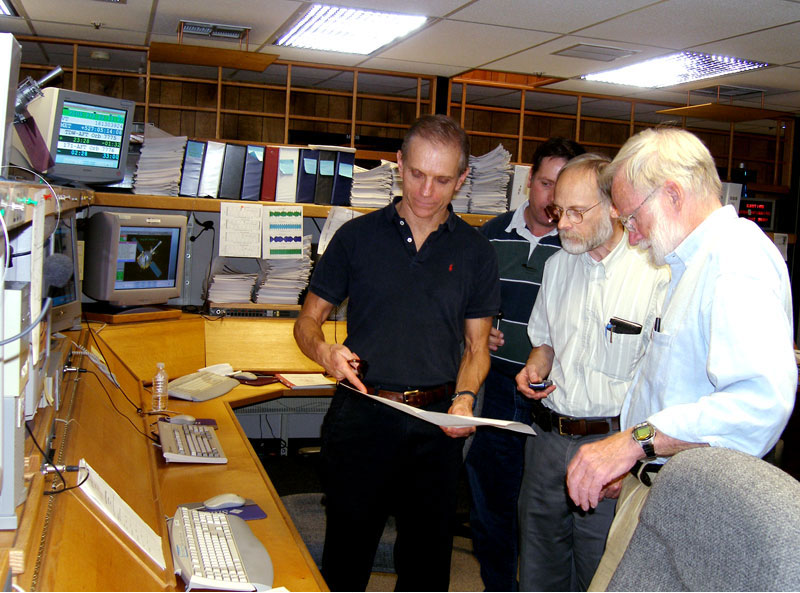
Two engineers discuss an anomaly
in the MOC.
The first anomaly in orbit occurred just two weeks into the mission at around 3:00 AM, when stray protons from a solar flare struck multiple critical memory cells in the main on-board flight computer, causing an automatic switch-over to the backup computer. The GP-B anomaly team was assembled by 4:30 AM that morning—within 90 minutes of the event—and they immediately began taking corrective action.
Over the course of the flight mission, the ARB successfully worked through 193 observations/anomalies. Of these, 23 were classified at true “anomalies,” five of which were sub-classified as “major anomalies,” including the B-Side computer switch-over and the stuck-open valve problems with two micro thrusters early in the mission, as well as subsequent computer and subsystem reboot problems due to radiation strikes. Of the remaining 18 anomalies, 12 were sub-classified as “medium anomalies” and 6 were sub-classified as “minor anomalies.”
Uploading commands to the spacecraft's
on-board computer during an anomaly
The 170 other issues (88%) were classified—at least initially—as “observations.” These observations typically documented various unanticipated events, sub-optimal parameter settings, and other unusual results that were monitored until their root cause was understood. In several cases, observations were escalated to anomaly status, and then necessary actions were taken first to understand, and then to correct the problem. In all cases, the established anomaly resolution process enabled the team to identify the root causes and provide procedures that led to recovery.
Anomalies on orbit did cause some disruptions in the data collection. Methods of treating these had been identified prior to launch and have been systematically addressed in the data analysis. You can view a summary table of all 193 GP-B anomalies and observations in Appendix D of the GP-B Post-Flight Analysis—Final Report to NASA.
Managing Program Risks
Through mission development, GP-B instituted a high-visibility risk steering committee, which program management used to evaluate and set overall program priorities. Risk groups met on a monthly basis; both Stanford and MSFC had independent risk evaluation teams, using different processes, that met regularly to share their assessments.
Hardware risks were evaluated on the basis of probability of occurrence, as well as the impact of potential failure, using a complete Failure Modes and Effects Analysis (FMEA) process. Other program risks (e.g., budget, schedule and personnel) were evaluated using a similar method. The committees solicited advice from independent councils of experts to ensure that our evaluations were correct. Five categories of risk were established, ranging from Level 1 (not likely, little cost or critical path impact, and no compromise in mission performance) to Level 5 (Nearly certain likelihood, very large program cost and critical path impact and loss of mission).
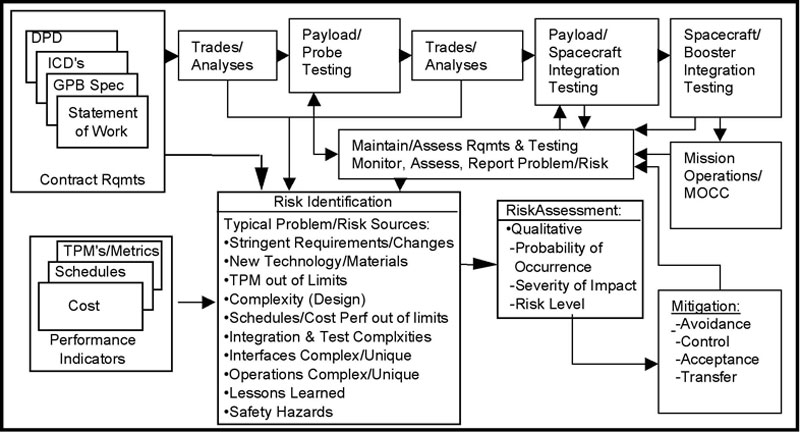
The GP-B risk assessment process
Based on potential impact to the program, each risk was evaluated using a table of risk levels and consequences as a guideline. The risk action was then assigned to one of three categories:
- Mitigate. Eliminate or reduce the risk by reducing the impact, reducing the probability or shifting the time frame.
- Watch. Monitor the risks and their attributes for early warning of critical changes in impact, probability, time frame, or other aspects.
- Accept. Do nothing. The risk will be handled as a problem if it occurs. No further resources are expended managing the risk.
Risks were promoted or demoted as program needs or technical understanding evolved. This risk mitigation process was an exceptionally good example of the complementary skills of the MSFC and Stanford-Lockheed teams, as borne out by the success of the mission.
Post-Science Instrument Calibrations
The MOC was a busy place during
the instrument calibration phase
Monitoring the progress of
instrument calibration procedures
An instrument calibration test
in progress
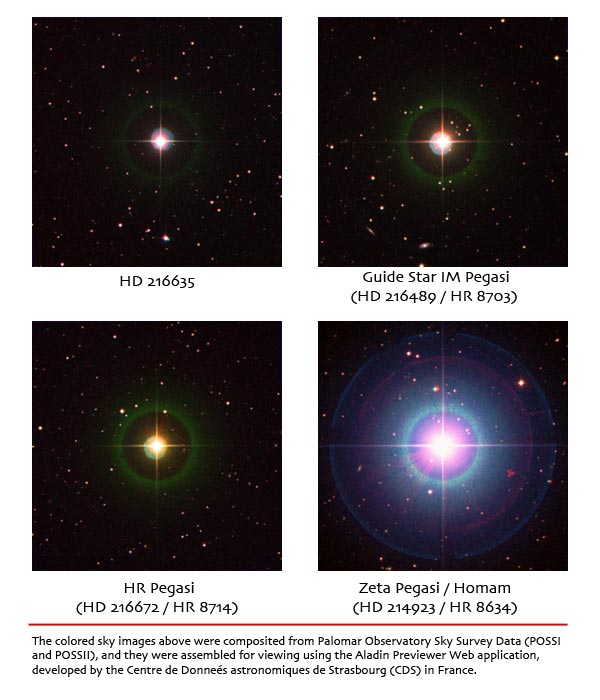
GP-B guide star, IM Pegasi
and neighboring stars "visited"
during calibration testing
The purpose of the post-science calibration phase was to perform tests to allow the placing of tight limits on systematic errors and gyroscope torques. A natural tension existed in choosing the correct moment to end the science phase and to begin the calibration phase. The technical underpinnings of this tension can be understood as follows. The total experiment error is the sum of three different types of error (plus the exact knowledge of the proper motion of the guide star). These three error sources are:
- Statistical measurement error
- Systematic errors
- Gyroscope torques
The overall experiment measurement error improves as the duration of the science data taking is increased. Systematic errors, however, do not. Furthermore, some systematic errors and gyroscope torques may not be directly evident from the science data and may require on-orbit tests to set upper limits on their effect. Therefore a longer calibration phase reduces the impact of systematic errors and gyroscope torques at the expense of statistical measurement error. The purpose of the calibration phase was therefore to enhance various possible systematic error sources so that tighter limits could be placed on each, thereby reducing the overall experiment error. This technical balance had to be blended with an important programmatic issue; risk management.
Risks and Tradeoffs
During the science phase each of the gyroscopes had a spin rate of more than 60 Hz, or a stored kinetic energy of more than 1 joule. Based upon years of ground testing, there was a concern that a de-levitation of a gyroscope would not only damage that gyroscope, but also put the other gyroscopes at some risk as well. Since the calibration phase required a number of new commands to be performed, the sequence of testing was adjusted to perform the low risk operations first. Another risk involved the possibility that calibration phase would not be completed prior to the depletion of the liquid helium. The final schedule for this phase involved performing a number of GSS tests followed by a 2 week break. The purpose of the break was to allow the team to assess the adequacy of the tests and to allow time to generate new commands that were determined to be needed to support the science team.
Summary of Calibration Procedures
In choosing to perform the GSS tests first, some of the gyroscopes could be kept in science mode while the others were GSS tested. Gyroscopes 2 and 3 entered the post-science calibration phase on July 7, 2005. Gyroscopes 1 and 4 entered the post-science calibration phase on August 15, 2005. A series of ATC tests followed the GSS tests. (GSS tests on gyroscopes 1 and 4 were also completed during this final stage of the mission.) The most important of these ATC tests involved intentionally mis-pointing the space vehicle to allow investigation of resulting gyroscope torques. A series of these tests were performed. These tests were not believed to be of high hardware risk (i.e. the risk of a gyroscope de-levitation was thought to be low, there was a consensus that the risk of schedule slippage was significant. For many of the mis-pointing operations, the vehicle was to acquire a star other than IM Pegasi. There was a very real concern that finding these other stars could be problematic and time consuming. In practice, just like the GSS phase which preceded it, the operations went off without a hitch. By the end of this period, moving back and forth between stars had become almost routine. The team had learned a tremendous amount during the IOC and science phases. (You can read a week-by-week summary of these calibration activities in our archive of GP-B Status Updates from August 19, 2005 - September 30, 2005.)
End of the Science Mission
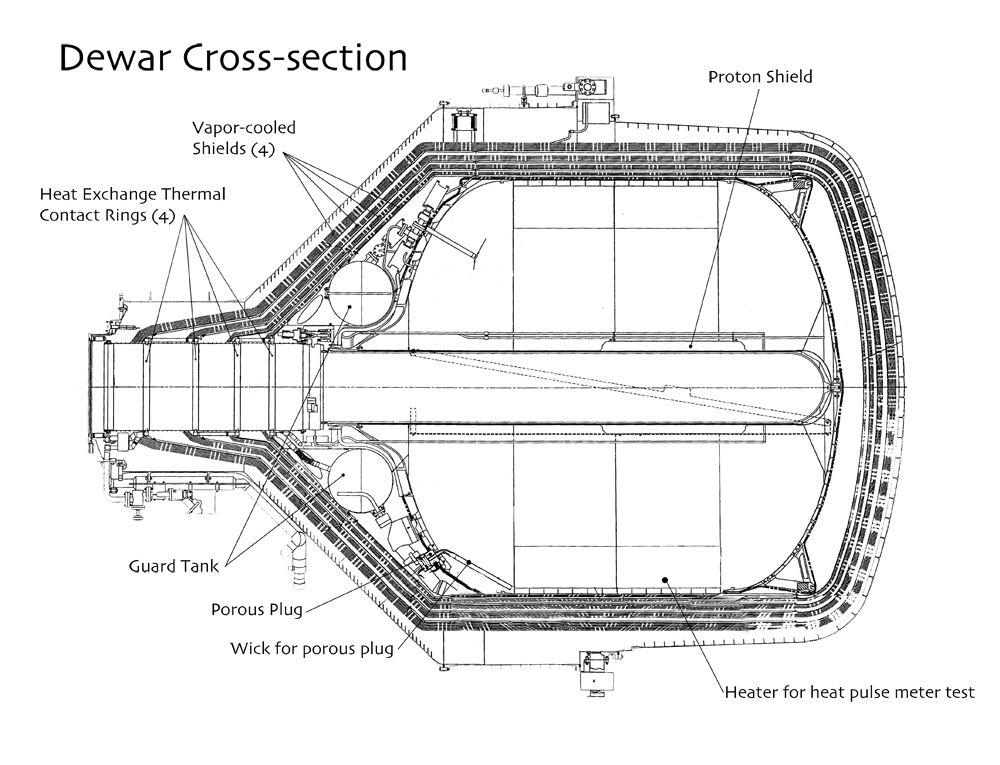
Cross-section of the GP-B dewar,
including heater for lifetime test
The length of the science and post-science instrument calibration phases of the mission were completely dependent on the amount of time that the liquid helium in the dewar would last. Once the spacecraft was in orbit, there was no means of measuring precisely how much helium remained in the dewar at any given time; rather it was only possible to estimate the amount of helium remaining, using .
Mission Lifetime Determinations
Members of the dewar team
examine dewar data confirming
that the helium was running out
Over the course of the science phase of the mission, the team performed a number of heat pulse meter operations on the dewar to estimate its remaining cryogenic lifetime, and in turn, the anticipated length of the science and subsequent instrument calibration phases of the mission. The results of these tests indicated that the helium remaining in the dewar would support approximately 10 months of science data collection and one month of instrument calibrations. Based on these dewar lifetime estimates, post-science calibration testing began in mid-August 2005, with the expectation that the helium in the dewar would be exhausted sometime during the first week in September 2005.
If you have driven a car, you may likely have experienced—at least once—the situation where the needle on the car's gas gage moves into the red zone, and the light comes on indicating that the gas tank is nearly empty. However, unless you've been in this situation a few times with any particular car, you don't know for sure how much farther you can drive before the engine finally sputters and stops running. This was essentially the situation with the GP-B dewar in early September 2005. The GP-B team knew that the helium remaining in the dewar was in the “red zone,” but how many more orbits could actually be sustained was basically anyone's guess. For this reason, the list of planned instrument calibration tests had been prioritized to ensure that the most essential tests were carried out before the helium was exhausted.
Dewar Helium Depletion
As things turned out, helium still remained in the dewar at the end of the first week in September, and in fact, the team was able to continue performing instrument calibration tests throughout the whole month of Septermber 2005. Around mid September, members of the dewar team discovered that their dewar lifetime estimates throughout the mission had been based on an incorrect assumption about the thermal connection between the liquid and gas phases of helium inside the dewar, leading to overly conservative helium lifetime predictions Revising this assumption with newer data, the dewar team estimated that helium depletion would occur towards the end of Sptember and possibly as late at mid-October. (See the 23 September 2005 GP-B Mission Status update for the complete story).
The mission operations team talks
with a NASA ground station following
helium depletion.
Helium depletion actually occurred during the afternoon of September 29, 20005. The evidence was clearly visible on the Dewar monitor screen. The pressure display had suddenly taken a nose-dive. Elsewhere in the MOC, GP-B scientists and engineers were clustered around the status monitors representing their respective areas of expertise, engaged in animated conversations. Meanwhile, the mission operations team members, headphones and microphones in place, were communicating with a NASA ground station, arranging for extra telemetry time.
Group photo of the team following
the final daily 'all-hands' team meeting.
There were some tense moments when all were patiently awaiting the download of more data that would confirm, unequivocally, that the liquid helium was depleted. The team was also attempting to turn on the Experiment Control Unit (ECU) on the spacecraft in order to receive some important data, such as the current temperature in the Dewar. It took several hours to arrange all the necessary telemetry passes, send the required commands to the spacecraft, and download the all the spacecraft status data. By late evening, it was clear that the liquid helium in the Dewar had run out, and that the Dewar and SQUIDs were slowly beginning to warm up.
On Friday morning, September 30, 2005, the entire team gathered for a final "all-hands" meeting to discuss details regarding the end of the GP-B science data collection and instrument calibration phases of the mission. The net result was that GP-B collected science data for 11.5 months, followed by 1.5 months of instrument calibration testing.
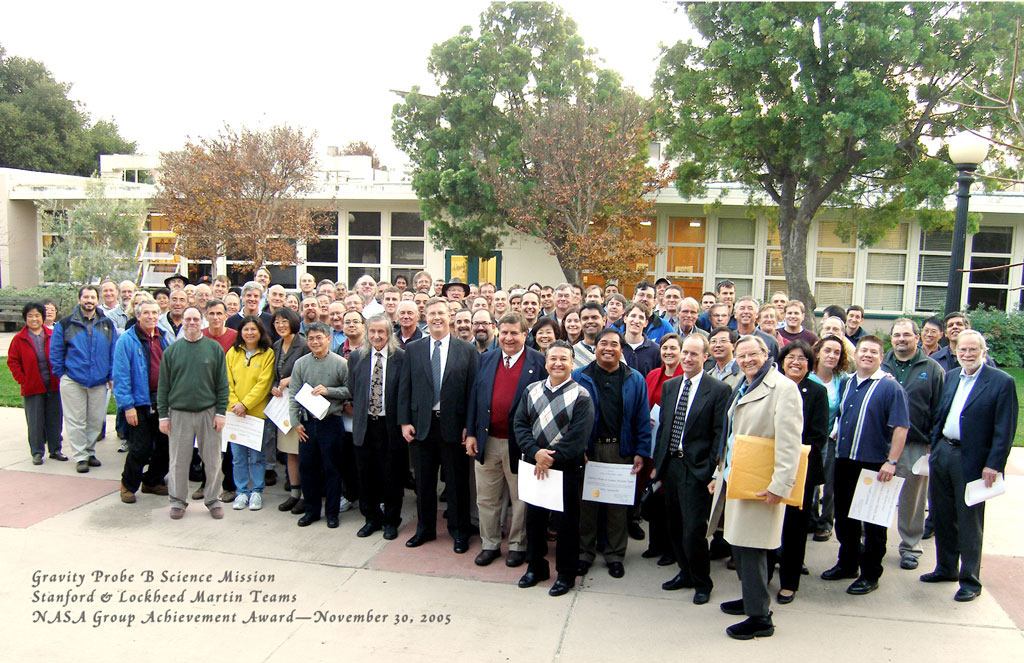
NASA Group Achievement Award
Stanford News Service video coverage
of NASA's GP-B award ceremony
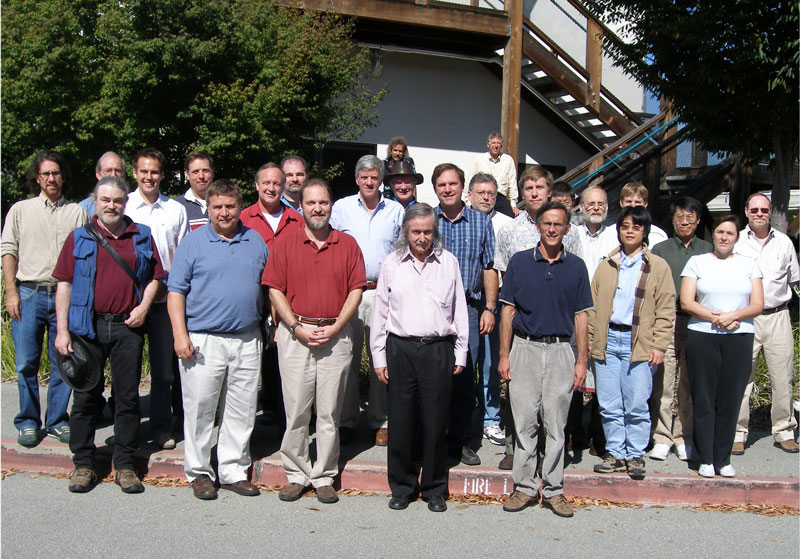
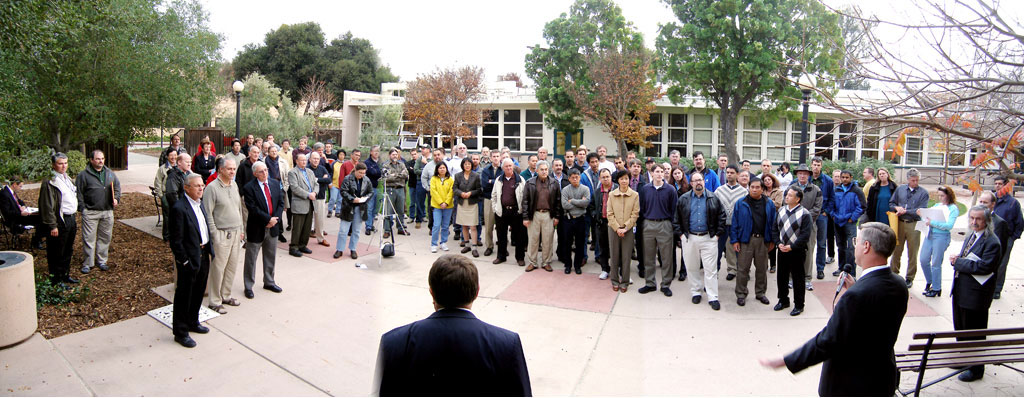
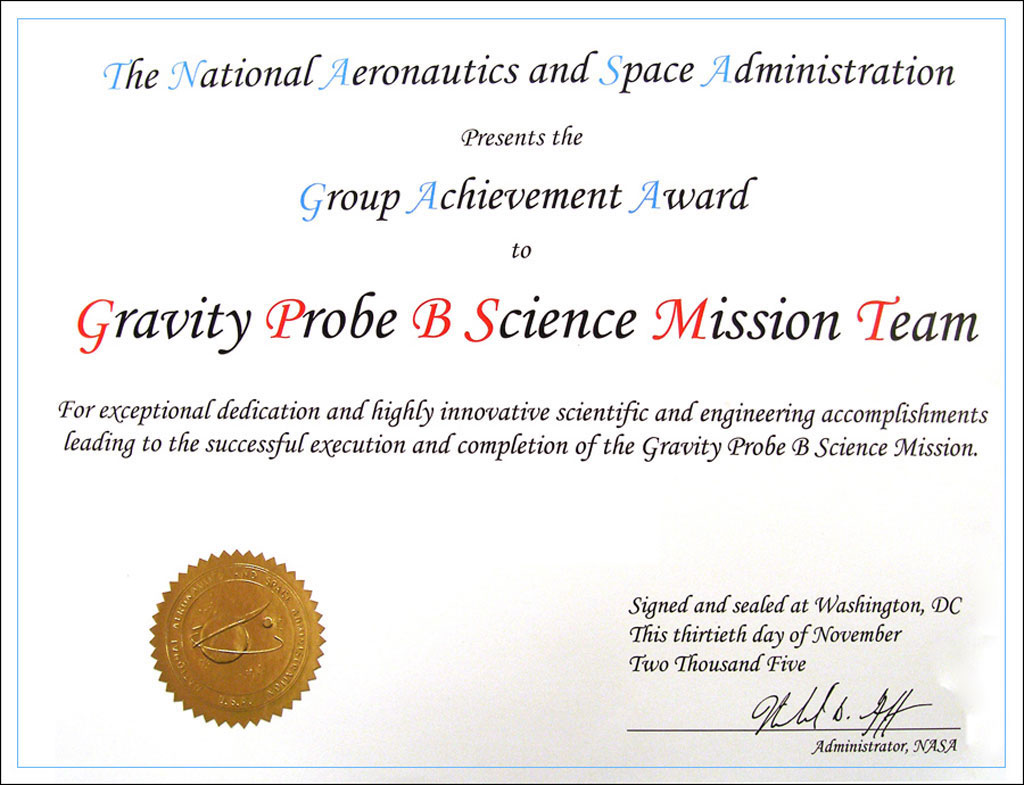
By the end of mission, the GP-B team had become very skilled at both operating the spacecraft and handling anomalies. Thus, there was some sadness when the mission ended and members of the mission operations team had to move on to new jobs and other missions. At the end of November 2005, shortly after the successful completion of the GP-B flight mission, NASA’s GP-B Program Manager, Tony Lyons from the Marshall Space Flight Center, presented a NASA Group Achievement Award to the entire GP-B science mission team, including people from both Stanford and Lockheed Martin. The award reads:
“For exceptional dedication and highly innovative scientific and engineering accomplishments leading to the successful execution and completion of the Gravity Probe B Science Mission.”
The award is signed by NASA Administrator Michael Griffin, and individual copies were given out to each and every member of the team.
 |
 |
 |
| NASA-MSFC GP-B Program Manager, Tony Lyons presents the NASA Group Achievement Award to the Stanford/Lockheed Martin GP-B team. |
The NASA Group Achievement Award certificate |
The whole GP-B team poses for a photo after receiving the NASA award. |
<- Launch & Checkout (Previous) | Data Analysis (Next) ->