WEEKLY UPDATE FOR 22 JULY 2005:
GRAVITY PROBE B MISSION STATUS AT A GLANCE
| Item | Current Status |
| Mission Elapsed Time | 458 days (65 weeks/15.02 months) |
| Science Data Collection | 329 days (48 weeks/10.79 months) |
| Current Orbit # | 6,757 as of 4:00 PM PST |
| Spacecraft General Health | Good |
| Roll Rate | Normal at 0.7742 rpm (77.5 seconds per revolution) |
| Gyro Suspension System (GSS) | All 4 gyros digitally suspended in science mode |
| Dewar Temperature | 1.82 kelvin, holding steady |
| Global Positioning System (GPS) lock | Greater than 98.5% |
| Attitude & Translation Control (ATC) | X-axis attitude error: 168.3 marcs rms |
| Command & Data Handling (CDH) | B-side (backup) computer in control Multi-bit errors (MBE): 0 Single-bit errors (SBE): 8 (daily average) |
| Telescope Readout (TRE) | Nominal |
| SQUID Readouts (SRE) | Nominal |
| Gyro #1 rotor potential | -1.9 mV |
| Gyro #2 rotor potential | +3.5 mV |
| Gyro #3 rotor potential | -3.7 mV as of 7/21 (currently undergoing calibration tests) |
| Gyro #4 rotor potential | -2.3 mV |
| Gyro #1 Drag-free Status | Backup Drag-free mode (normal) |
MISSION DIRECTOR'S SUMMARY
As of Mission Day 458, the Gravity Probe B vehicle and payload are in good health. All four gyros are digitally suspended in science mode. The spacecraft is flying drag-free around Gyro #1.
Preliminary calibration testing of gyros #1, #2, and #4, which does not place torques (forces) on the gyros, continued this past week. Also, we continued calibration testing of gyro #3, which involved electrically "nudging" the gyro #3 rotor to various pre-defined positions within its housing. During this test, gyro #3 transitioned into analog suspension mode. However, anticipating this condition, we automatically re-suspended the gyro rotor and increased the gyro bridge excitation voltage during the calibration test. Based on the performance of gyro #3, we will now include the auto-suspension and increased excitation voltages when running this test on the other three gyros.
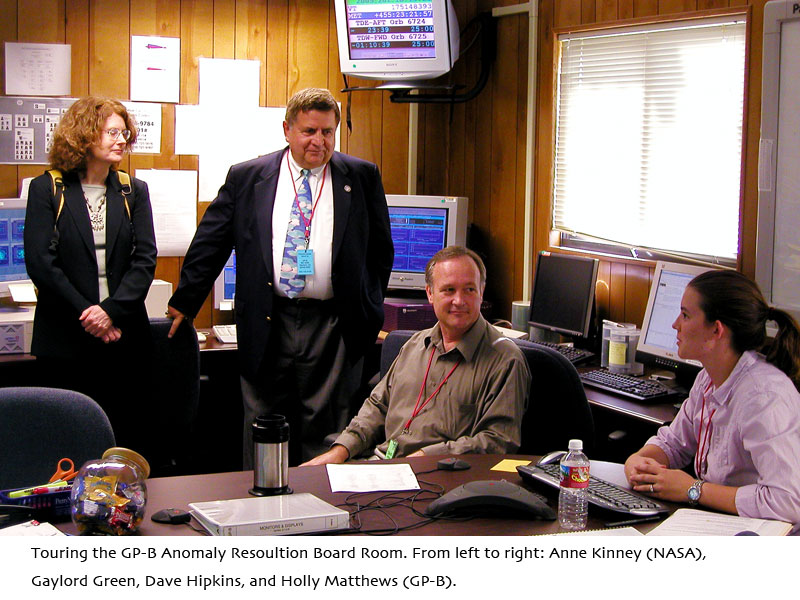
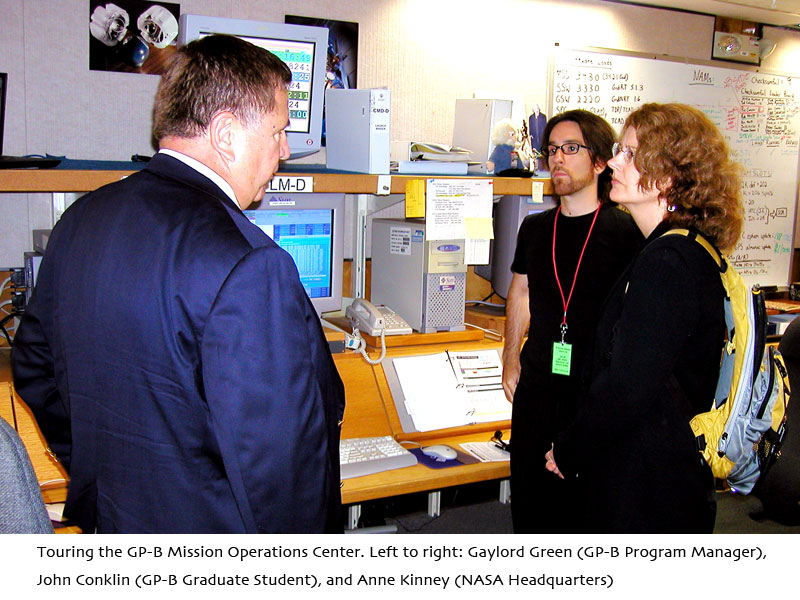

On Wednesday, 20 July 2005, Dr. Anne Kinney, Director of the Universe Division in NASA's Science Mission Directorate, spent the day here at Stanford, meeting with various research teams and reviewing the status of GP-B and several other joint Stanford-NASA missions/experiments that fall under her jurisdiction at NASA Headquarters. This was Dr. Kinney's first on-site visit to GP-B, so the day began with a brief tour of the GP-B facilities, followed by a series of briefings and discussions. At the end of the day, Dr. Kinney gave a very interesting lecture to a standing room only audience from the Stanford physics and aerospace community on the topic of "Blue Planets, Black Holes."
MISSION NEWS—SEPARATING THE WHEAT FROM THE CHAFF: AN OVERVIEW OF THE SCIENCE DATA ANALYSIS PROCESS
We are entering the final weeks of science data collection and preparing for the final instrument calibration tests before the helium in the Dewar is exhausted, sometime around Labor Day. At that point, the main focus of GP-B will shift from mission operations to data analysis. The painstaking scientific analysis work will require over a year to complete, followed by up to six months of preparing and submitting scientific papers to major scientific journals. This process will culminate in the announcement and publication of the results, now anticipated to occur in April 2007. Thus, in this week's Mission News it seems appropriate to provide an overview of what is involved in the GP-B data analysis process.
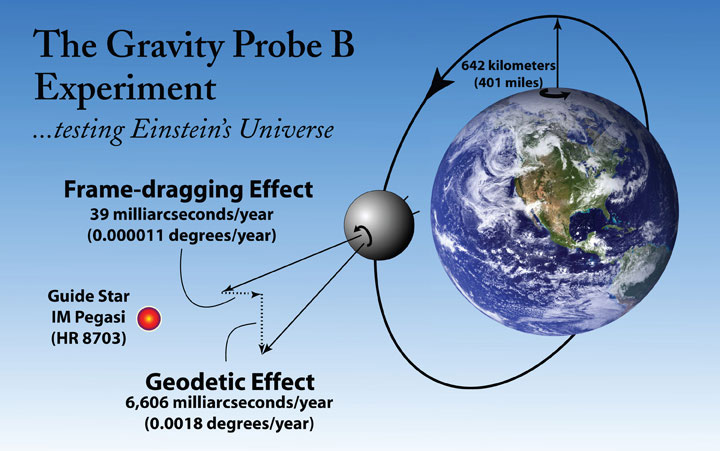
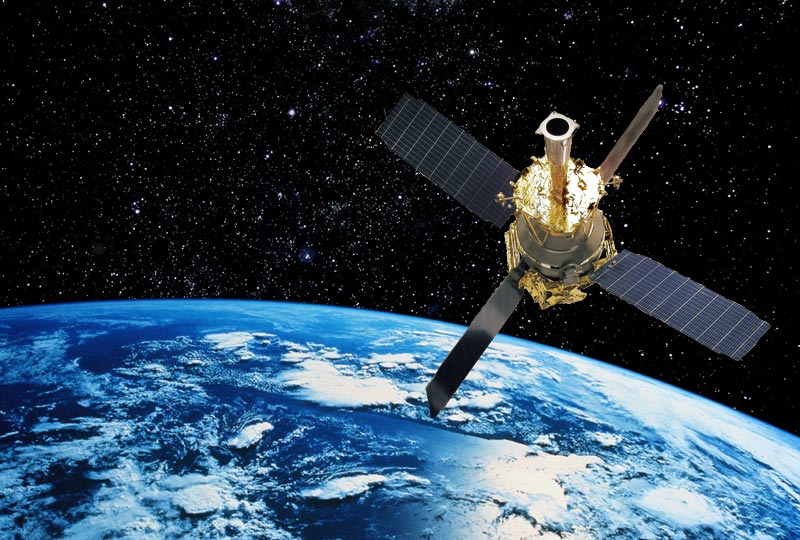
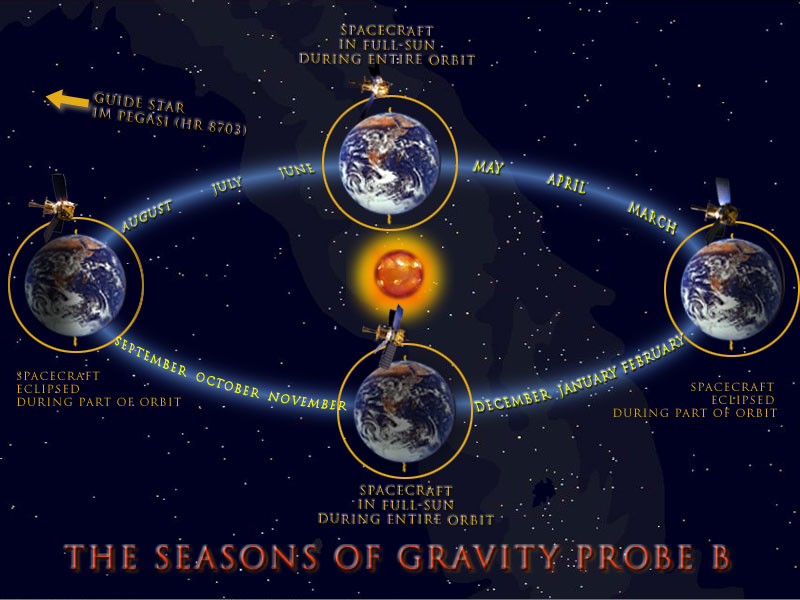
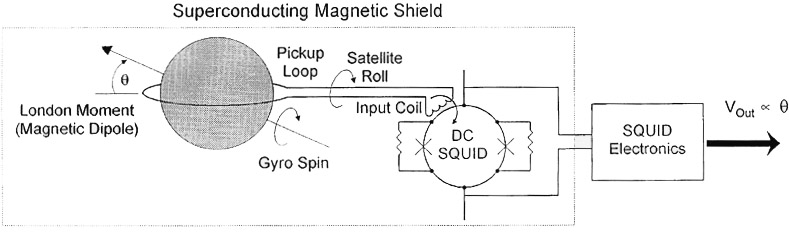
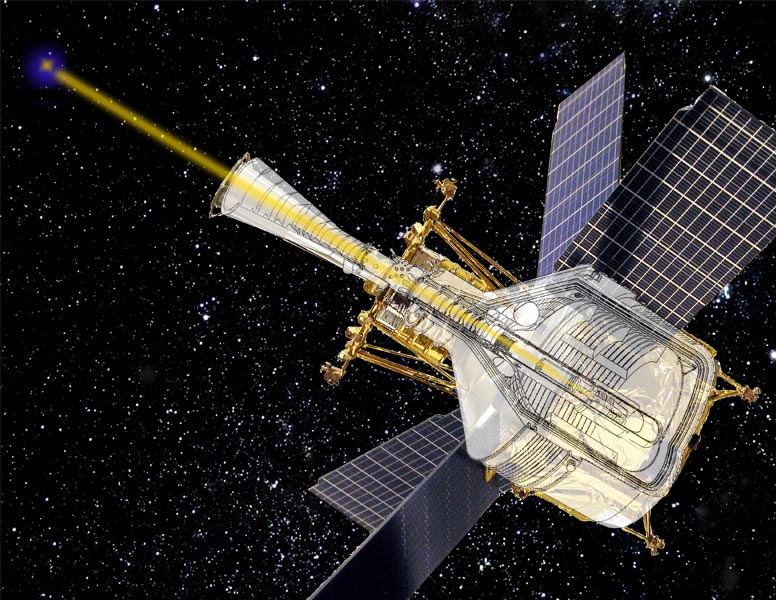
Conceptually the GP-B experimental procedure is simple: At the beginning of the experiment, we point the science telescope on-board the spacecraft at the guide star, IM Pegasi, and we electrically nudge the spin axes of the four gyroscopes into the same alignment. Then, over the course of a year, as the spacecraft orbits the Earth some 5,000 times while the Earth makes one complete orbit around the Sun, the four gyros spin undisturbed---their spin axes influenced only by the relativistic warping and twisting of spacetime. We keep the telescope pointed at the guide star, and each orbit, we record the cumulative size and direction of the angle between the gyroscopes' spin axes and the telescope. According to the predictions of Einstein's general theory of relativity, over the course of a year, an angle of 6.6 arcseconds should open up in the plane of the spacecraft's orbit, due to the warping of spacetime by the Earth, and a smaller angle of 0.041 arcseconds should open up in the direction of Earth's rotation due to the Earth dragging its local spacetime around as it rotates.
In reality, what goes on behind the scenes in order to obtain these gyro drift angles is a very complex process of data reduction and analysis that will take the GP-B science team more than a year to bring to completion. As we noted in our Mission News story of 14 January 2005, we continuously collect data during all scheduled telemetry passes with ground stations and communications satellites, and this telemetered data is stored--in its raw, unaltered form--in a database here at the GP-B Mission Operations Center. This raw data is called “Level 0” data. The GP-B spacecraft is capable of tracking some 10,000 individual values, but we only capture about 1/5 of that data. The Level 0 data includes a myriad of status information on all spacecraft systems in addition to the science data, all packed together for efficient telemetry transmission. So, our first data reduction task is to extract all of the individual data components from the Level 0 data and store them in the database with mnemonic identifier tags. These tagged data elements are called “Level 1” data. We then run a number of algorithmic processes on the Level I data to extract ~500 data elements that will be used for science data analysis, and this is called “Level 2 data.” While Level 2 data includes information collected during each entire orbit, our science team generally only uses information collected during the Guide Star Valid (GSV) portion of each orbit when the telescope is locked onto the guide star. We do not use any gyroscope or telescope data collected during the Guide Star Invalid (GSI) portion of each orbit, when the spacecraft is behind the Earth, eclipsed from a direct view of the guide star, for science data analysis.
The data collection in the GP-B experiment is similar to fitting a curve to a set of data points--the more data points collected, the more accurate the curve. If there were no noise or error in our gyro readouts, and if we had known the exact calibrations of these readouts at the beginning of the experiment, then we would only need two data points--a starting point and an ending point. However, since we are determining the exact readout calibrations as part of the experiment, collecting all of the data points in between enables us to determine these unknown variables. In other words, the shape of the data curve itself is just as important as the positions of the starting and ending points.
All measurements we collect are time-stamped to an accuracy 0.1 milliseconds. This enables our science team to correlate the data collected from all four gyros. If one gyro's data is not available for a particular time period, such as the first three weeks of the science phase when gyro #4 was still undergoing spin axis alignment, that gyro is simply not included in the analysis for that particular time period. In cases where all science data is lost for an orbit or two, the effect of these small data gaps on the overall experiment is very small. Examples of such data gaps include the 4 March 2005 automatic switch-over from the A-side (main) on-board computer to the B-side (backup) computer, and a few telemetry ground station problems over the course of the mission.
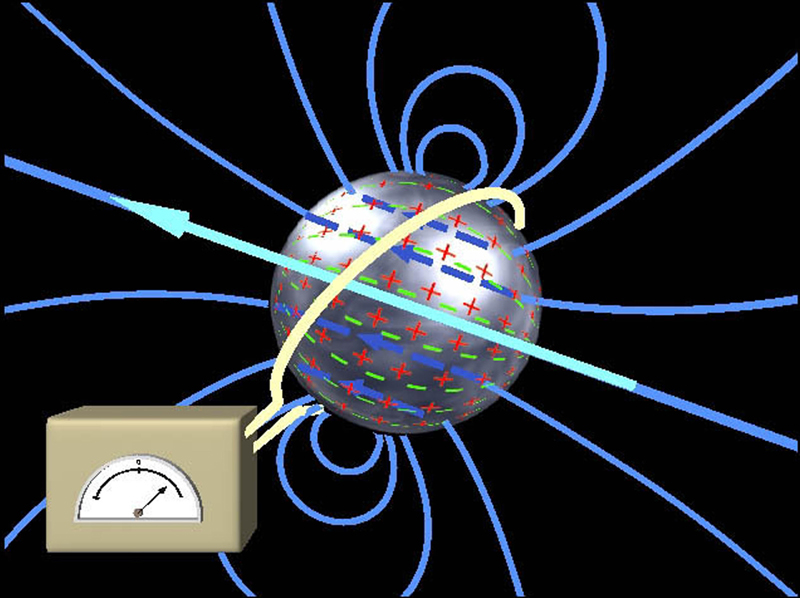
Another important point is that the electronic systems on-board the spacecraft do not read out angles. Rather, they read out voltages, and by the time these voltages are telemetered to Earth and received in the science database here in the Stanford GP-B Mission Operations Center, they have undergone many conversions and amplifications. Thus, in addition to the desired signals, the GP-B science data includes a certain amount of random noise, as well as various sources of interference. The random noise averages out over time and is not an issue. Some of what appears to be regular, periodic interference in the data is actually important calibrating signals that enable us to determine the size of the scale factors that accompany the science data. In last week's Mission News story, we described how the orbital and annual aberration of the starlight from IM Pegasi is used as a means of calibrating the gyro readout signals. Likewise, in the Mission News story of 6 May 2005, we described how the telescope dither motion is used to calibrate the telescope signals. In addition, over the course of the mission we have discovered a few unexpected sources of interference that must be appropriately modeled and removed from the data. The error analysis is well in hand, but careful and painstaking cross checks are required by our science team to ensure the validity of the final experimental results.
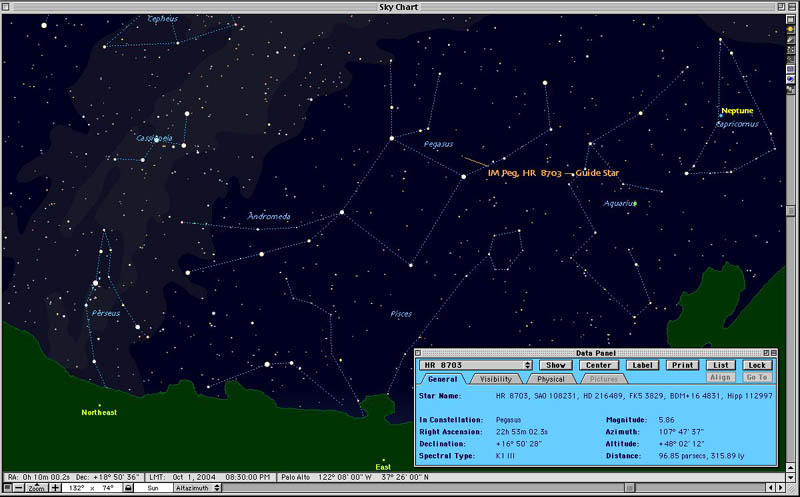
Finally, there is one more very important factor that must be addressed in calculating the final results of the GP-B experiment. We selected IM Pegasi, a star in our galaxy, as the guide star because it is both a radio source and it is visually bright enough to be tracked by the science telescope on-board the spacecraft. Like all stars in our galaxy, the position of IM Pegasi as viewed from Earth and our science telescope changes over the course of a year. Thus, the GP-B science telescope is tracking a moving star, but gyros are unaffected by the star's so called “proper motion;” their pointing reference is IM Pegasi's position at the beginning of the experiment. Thus, each orbit, we must subtract out the telescope's angle of displacement from its original guide star orientation so that the angular displacements of the gyros can be related to the telescope's initial position, rather than its current position. The annual motion of IM Pegasi with respect to a distant quasar has been measured with extreme precision over a number of years using a technique called Very Long Baseline Interferometry (VLBI) by a team at the Harvard-Smithsonian Center for Astrophysics (CfA) led by Irwin Shapiro, in collaboration with astrophysicist Norbert Bartel and others from York University in Canada and French astronomer Jean-Francois Lestrade. However, to ensure the integrity of the GP-B experiment, we added a "blind" component to the data analysis by requesting that the CfA withhold the proper motion data that will enable us to pinpoint the orbit-by-orbit position of IM Pegasi until the rest of our data analysis is complete. Therefore, the actual drift angles of the GP-B gyros will not be known until the end of the data analysis process.
UPDATED NASA/GP-B FACT SHEET AVAILABLE FOR DOWNLOADING
We recently updated our NASA Factsheet on the GP-B mission and experiment. You'll now find this 6-page document (Adobe Acrobat PDF format) listed as the last navigation link under "What is GP-B" in the upper left corner of this Web page. You can also click here to download a copy.
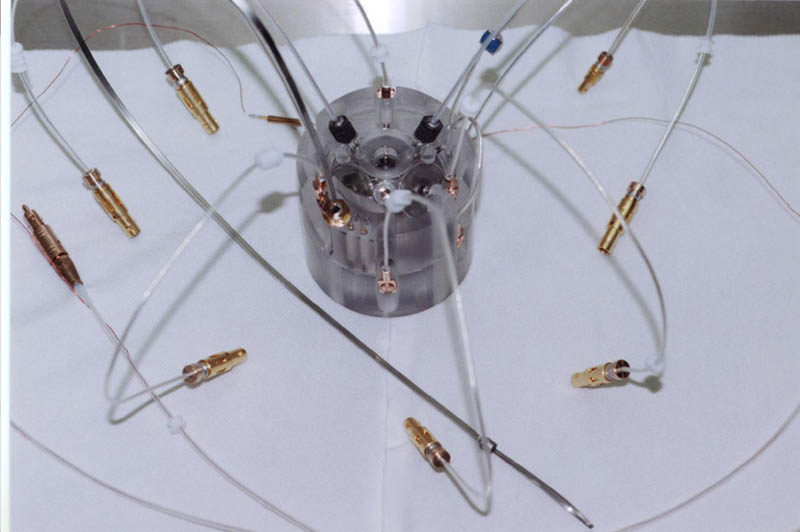
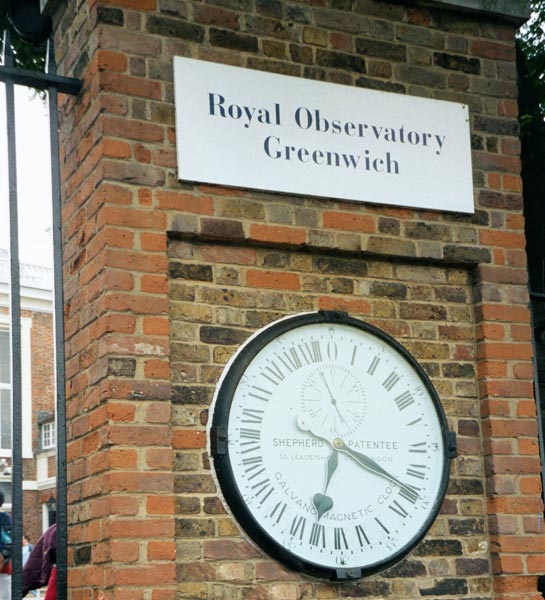
Drawings & Photos: The layered composite photos of the GP-B spacecraft orbiting the Earth and starlight from IM Pegasi entering the spacecraft's telescope, as well as the GP-B experiment diagram were created by GP-B Public Affairs Coordinator, Bob Kahn using Adobe Photoshop and Adobe Illustrator. Mr. Kahn also took the photos of the Greenwich Observatory and the photos of Dr. Anne Kinney from NASA Headquarters visiting GP-B. The photo of the gyroscope housing and the SQUID readout diagrams are from the GP-B Image Archive here at Stanford. The sky chart image, showing the guide star, IM Pegasi was generated by the Voyager III Sky Simulator from Carina Software. Click on the thumbnails to view these images at full size.
MORE LINKS ON RECENT TOPICS
- Track the satellite in the sky
- Photo, video & and news links
- Build a paper model of the GP-B Spacecraft
- Following the mission online
- Our mailing list—receive the weekly highlights via email
- The GP-B Launch Companion in Adobe Acrobat PDF format. Please note: this file is 1.6 MB, so it may take awhile to download if you have a slow Internet connection.
Previous Highlight
Index of Highlights