WEEKLY UPDATE FOR 11 FEBRUARY 2005:
GRAVITY PROBE B MISSION STATUS AT A GLANCE
| Item | Current Status |
| Mission Elapsed Time | 297 days (42 weeks/9.75 months) |
| Science Data Collection | 168 days (24 weeks/5.5 months) |
| Current Orbit # | 4,384 as of 4:00 PM PST |
| Spacecraft General Health | Good |
| Roll Rate | Normal at 0.7742 rpm (77.5 seconds per revolution) |
| Gyro Suspension System (GSS) | All 4 gyros digitally suspended in science mode |
| Dewar Temperature | 1.82 kelvin, holding steady |
| Global Positioning System (GPS) lock | Greater than 98.5% |
| Attitude & Translation Control (ATC) | X-axis attitude error: 182.5 marcs rms |
| Command & Data Handling (CDH) | Multi-bit errors (MBE): 0 Single-bit errors (SBE): 1,731 (daily average) |
| Telescope Readout (TRE) | Nominal |
| SQUID Readouts (SRE) | Nominal |
| Gyro #1 rotor potential | -3.6 mV |
| Gyro #2 rotor potential | +5.1 mV |
| Gyro #4 rotor potential | -8.7 mV |
| Gyro #3 Drag-free Status | Backup Drag-free mode (normal) |
MISSION DIRECTOR'S SUMMARY
As of Mission Day 297, the Gravity Probe B vehicle and payload are in good health, with all systems functioning nominally and more than five months of science data collected. All four gyros are digitally suspended in science mode and the spacecraft is flying drag-free around Gyro #3.This past week was a quiet one for GP-B, with very few activities scheduled. The solar flares that caused us to lose the guide star three weeks ago came around to the front of the Sun, facing towards Earth, again this past week. We took extra precautions and scheduled extra telemetry passes to deal with possible effects of these solar flares on the spacecraft. However, this time, the solar flares produced no substantial geomagnetic activity around the Earth. This may be a sign that the Sun has moved into a quieter part of the solar cycle.
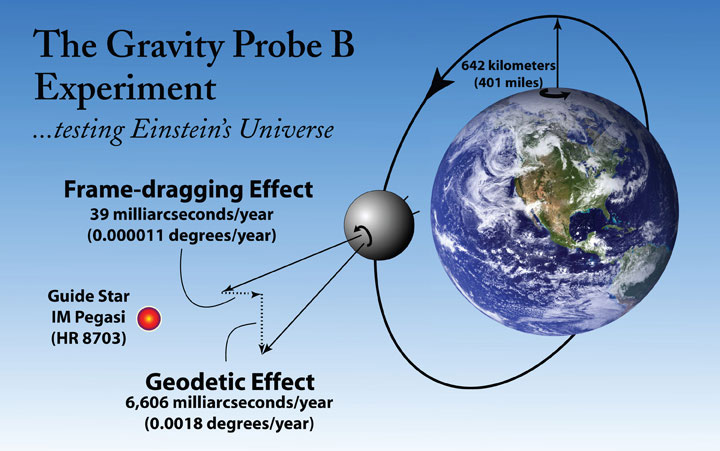
MISSION NEWS—MAPPING THE BRIGHTNESS OF IM PEGASI FROM THE GP-B SPACECRAFT
One of the interesting astronomical side benefits of the GP-B experiment is that the telescope aboard the spacecraft has now been locked onto the guide star IM Pegasi for a portion of nearly every orbit for over five months. Compared to ground-based observations of stars, which can only be accomplished once daily at best (and often much less frequently due to weather and other complicating factors), the GP-B telescope’s observations have provided a unique set of quasi-continuous photometric observations that display the variable nature of the star’s brightness over a five-month period. The two graphs to the right show brightness data for IM Pegasi, gathered by our GP-B science telescope on-board the spacecraft over the past five months.
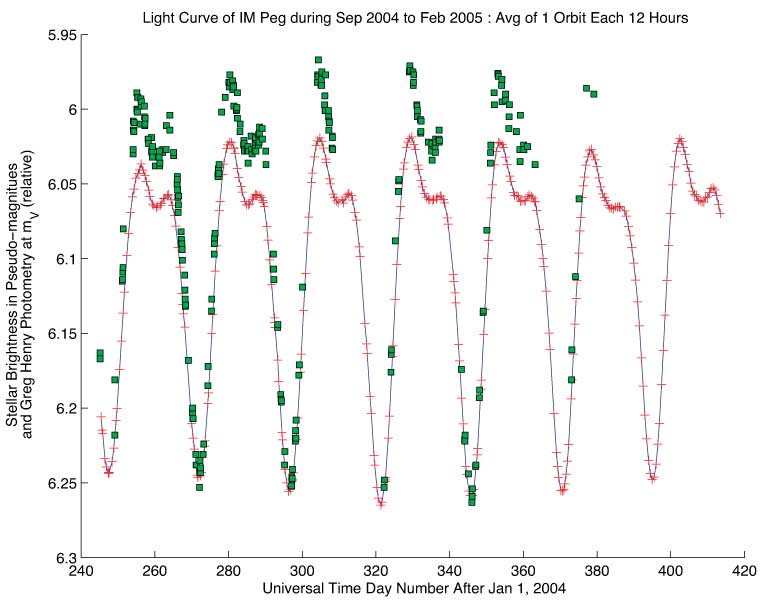
The first (upper) graph shows a comparison of contemporaneous ground-based observations, made by astronomer Greg Henry at Tennessee State University, during the same five-month period as the GP-B telescope’s observations. The green squares on the graph are Greg Henry’s observations in the visible wavelength range. The red plus signs on the graph are measurements that were taken by the GP-B telescope approximately every ninth orbit (about twice a day), and they represent only a small portion of the GP-B data that has been collected. This graph shows that the amplitude of variability of IM Pegasi is smaller in the GP-B radiation pass band than in Greg Henry’s visible pass band.
IM Pegasi is known to be an RS CVn type variable star with 24.6-day period. Among other interesting characteristics, RS CVn stars vary in brightness, that can be explained by the presence of star spots (analogous to mammoth sun spots). These star spots rotate around with the star’s rotation period, and they cause the star’s light to fade whenever it faces the Earth. The time dependence of the variation of RS CVn type stars is one way to distinguish them from eclipsing binary stars or pulsating variable stars.
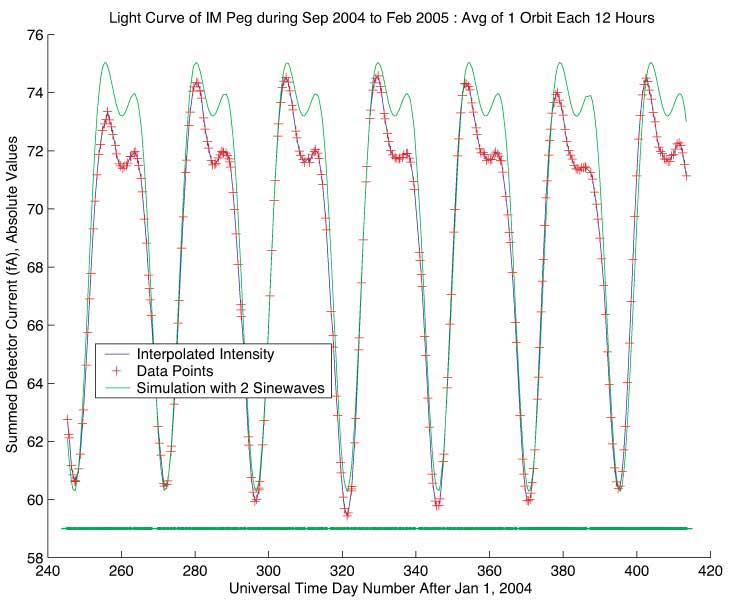 The second (lower) graph shows a comparison of the GP-B observations with a model consisting of the sum of two sine waves—one at the fundamental frequency and the other at the first harmonic. In this graph, the green line is the model, the red “+” symbols are the actual data points from the GP-B telescope, and the dark lines are interpolated values between the data points. The model curve is double-peaked because the relative phases of the two sine waves and their amplitudes have been adjusted to simulate the star. The measurement errors of the actual data are shown in the flat green line at the bottom of the plot, and they are smaller than the points used to plot them.
The data collected by the GP-B telescope on the guide star, IM Pegasi, comprises a unique set of observations that can be used to analyze the temporal variability of the star’s brightness to a high level of precision. The data shown in the two graphs and the corresponding analysis described above were provided by John Goebel, an astronomer from the NASA Ames Research Center in Mountain View, CA. who has been working with our GP-B team for the past nine years.
| QUICK FACTS ON IM PEGASI | ||
|---|---|---|
| Alternative Names | IM Peg, HR 8703, HD 216489, SAO 108231, BD +16 4831, FK5: 3829 | |
| Distance from Earth | ~100 parsecs / ~300 light years | |
| Position on December 5/6, 2003 | ||
| Right Ascension | (J2000) = 22h 53m 02.3s | |
| Declination | (J2000) = +16d 50m 28.2s | |
| V Magnitude | ||
| Minimum Light | 6.0 | |
| Maximum Light | 5.7 | |
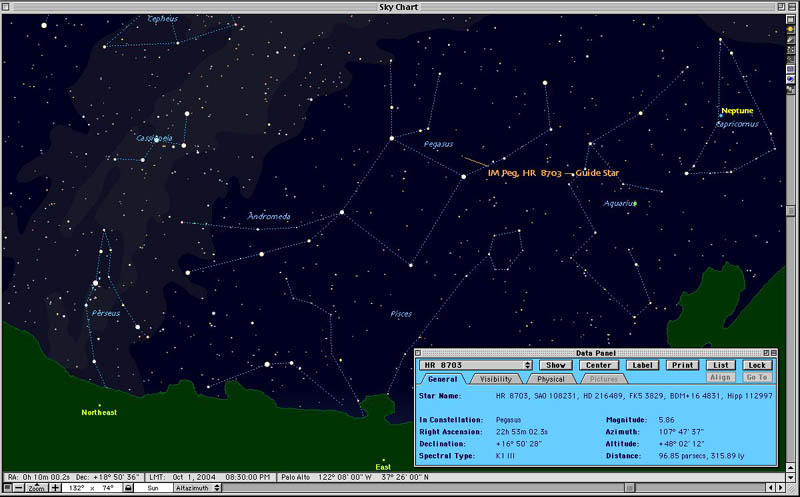
| Pegasi means “of or in Pegasus,” which is a constellation easily seen high overhead on autumn evenings throughout North America, Europe, and Asia. In any constellation, the brighter variable stars are designated with a pair of letters, chosen more or less sequentially—in this case, "IM." The screen capture to the right, from Carina Software’s Voyager III Sky Simulator, shows the location of IM Pegasi in the constellation Pegasus. | ||
| Even at it brightest magnitude, IM Pegasi is barely bright enough to see with the naked eye under very dark and clear skies, but when observed in the microwave range, this star is often among the brightest in the sky. | ||
IM Pegasi is actually part of a binary star system, like perhaps half of the stars in our Galaxy. A binary star system consists of two stars orbiting each other. In the case of IM Pegasi, a smaller and much dimmer star and a larger brighter star orbit each other, creating some wobble in the position of the larger star. Because of its periodic nature, this motion will have only a very small effect on the GP-B relativity experiment, although it may be detectable in the data collected. |
||
MORE INFORMATION ON IM PEGASI
For readers who are interested, following are links to more information about the GP-B Guide Star IM Pegasi:
- For a description of how/why we chose IM Pegasi as the guide star and its significance to the GP-B experiment, see the Guide Star FAQ on this Web site, or download a PDF copy of the GP-B Launch Companion, and see pages 18-20.
- The Harvard-Smithsonian Center for Astrophysics (Cambridge) and York University (Toronto) are studying the guide star to provide crucial measurements of its motion relative to far away quasars. These measurements are needed to relate the tiny changes in the gyroscopes' spin direction to the distant universe, so that general relativity can be tested. Learn more about these measurements by going to the IM Pegasi web site at York University.
- The Institute of Astronomy at the ETH in Zurich, Switzerland, is working with the Harvard-Smithsonian Center for Astrophysics to provide detailed optical information about the GP-B guide star, IM Pegasi. You can find out about the ETH Institute's work in monitoring magnetic activity on IM Pegasi and the Doppler Imaging Technique used for this purpose on the ETH Institute of Astronomy GP-B Web page.
- Photos, taken through a telescope by Swiss physics teacher and amateur astronomer Stefano Sposetti, of GP-B spacecraft in orbit, passing near IM Pegasi.These and other astronomical photos taken by Mr. Sposetti are displayed on Mr. Sposetti’s Web page in the Astronomical Image Data Archive (AIDA).
THE EINSTEIN EXHIBITION AT THE SKIRBALL CULTRAL CENTER IN LOS ANGELES
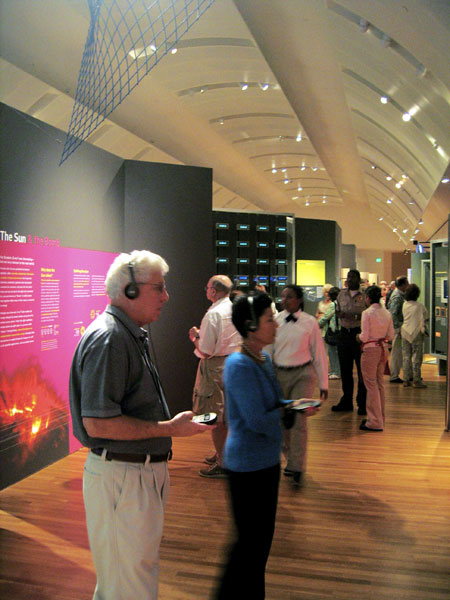 If you're going to be in Los Angeles anytime before 30 May 2005, and if you’re interested in Einstein’s life and work, the Einstein Exhibition at the Skirball Cultural Center (just north of the Getty Museum on Interstate 405) is the most comprehensive presentation ever mounted on the life and theories of Albert Einstein (1879-1955). It explores his legacy not only as a scientific genius who re-configured our concepts of space and time, but also as a complex man engaged in the social and political issues of his era. It examines the phenomenon of his fame and his enduring status as a global icon whose likeness has become virtually synonymous with genius.
In this exhibit, you can examine Einstein's report card, inspect his FBI file, and enjoy his family photographs, love letters, and diary entries. Exhibition highlights include scientific manuscripts and original correspondence—including original handwritten pages from the 1912 manuscripts of the special theory of relativity and his 1939 letter to President Roosevelt about nuclear power—and a wealth of other documents from the Albert Einstein Archives at the Hebrew University of Jerusalem.
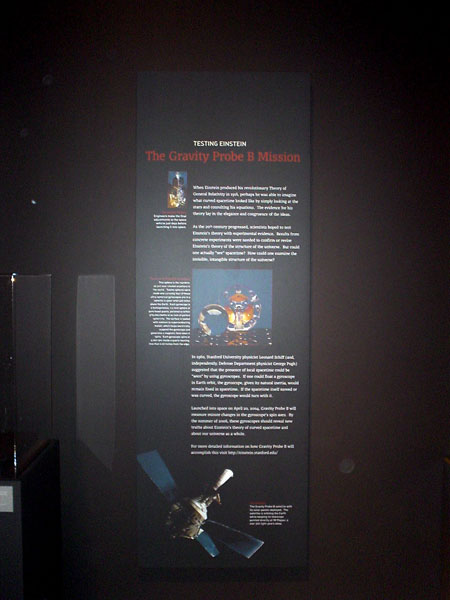
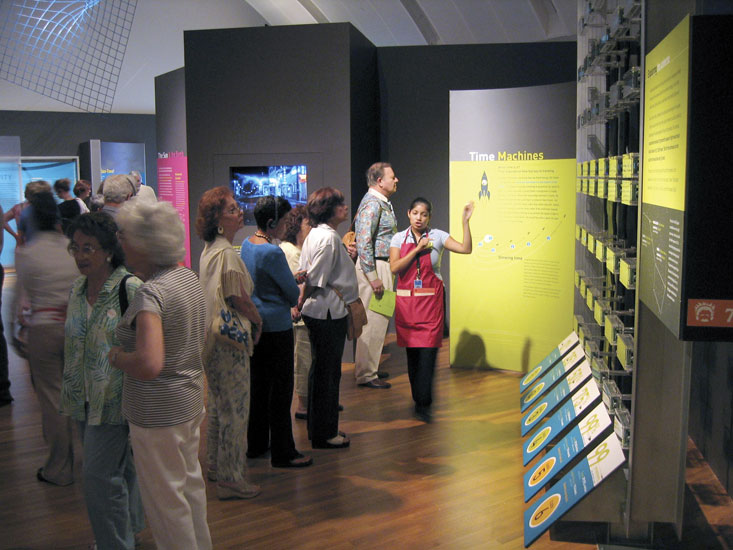
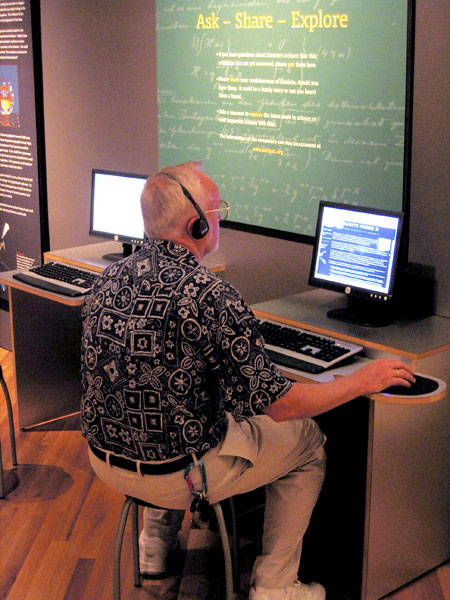
In addition to these displays of Einstein memorabilia, the exhibit also features a number of interactive components that help provide an understanding of Einstein's revolutionary theories. Furthermore, several “explainers,” identified by their red aprons, are on hand to discuss various aspects of the exhibit and to explain and demonstrate difficult concepts, such as time dilation and warped spacetime. At the end of the exhibit, you’ll find one of GP-B’s gyro rotors on display.
The Einstein exhibition was jointly organized by the American Museum of Natural History (AMNH), the Hebrew University of Jerusalem, and the Skirball Cultural Center. It was designed by the AMNH under the supervision of Dr. Michael Shara, curator of the exhibit and chairman of the museum’s Astrophysics Department. It opened in November 2002 at the AMNH in New York and then traveled to Chicago and Boston, spending about 8 months in each location. It will remain at its final U.S. stop at the Skirball Center in Los Angeles through 29 May 2005, after which time it will move permanently to the Hebrew University in Jerusalem.
Information about the Einstein exhibition is available on the Skirball Center Web site. If you can’t make it to Los Angeles, you can visit the AMNH’s virtual Einstein exhibit on the Web.
Drawing, screen capture, and photos: GP-B Public Affiars Coordinator, Bob Kahn, created the diagram of the GP-B experiment. The two graphs were produced by NASA/GP-B astronomer, John Goebel. The screen capture of IM Pegasi in the October 1st mid-evening sky, as viewed from Stanford University in Palo Alto, California, was generated by the Voyager III Sky Simulator from Carina Software.The photos from the Einstein Exhibit are courtesy of the Skirball Cultural Center. Click on the thumbnails to view these images at full size.
MORE LINKS ON RECENT TOPICS
- Track the satellite in the sky
- Photo, video & and news links
- Build a paper model of the GP-B Spacecraft
- Following the mission online
- Our mailing list - receive the weekly highlights via email
- The GP-B Launch Companion in Adobe Acrobat PDF format. Please note: this file is 1.6 MB, so it may take awhile to download if you have a slow Internet connection.
Previous Highlight
Index of Highlights