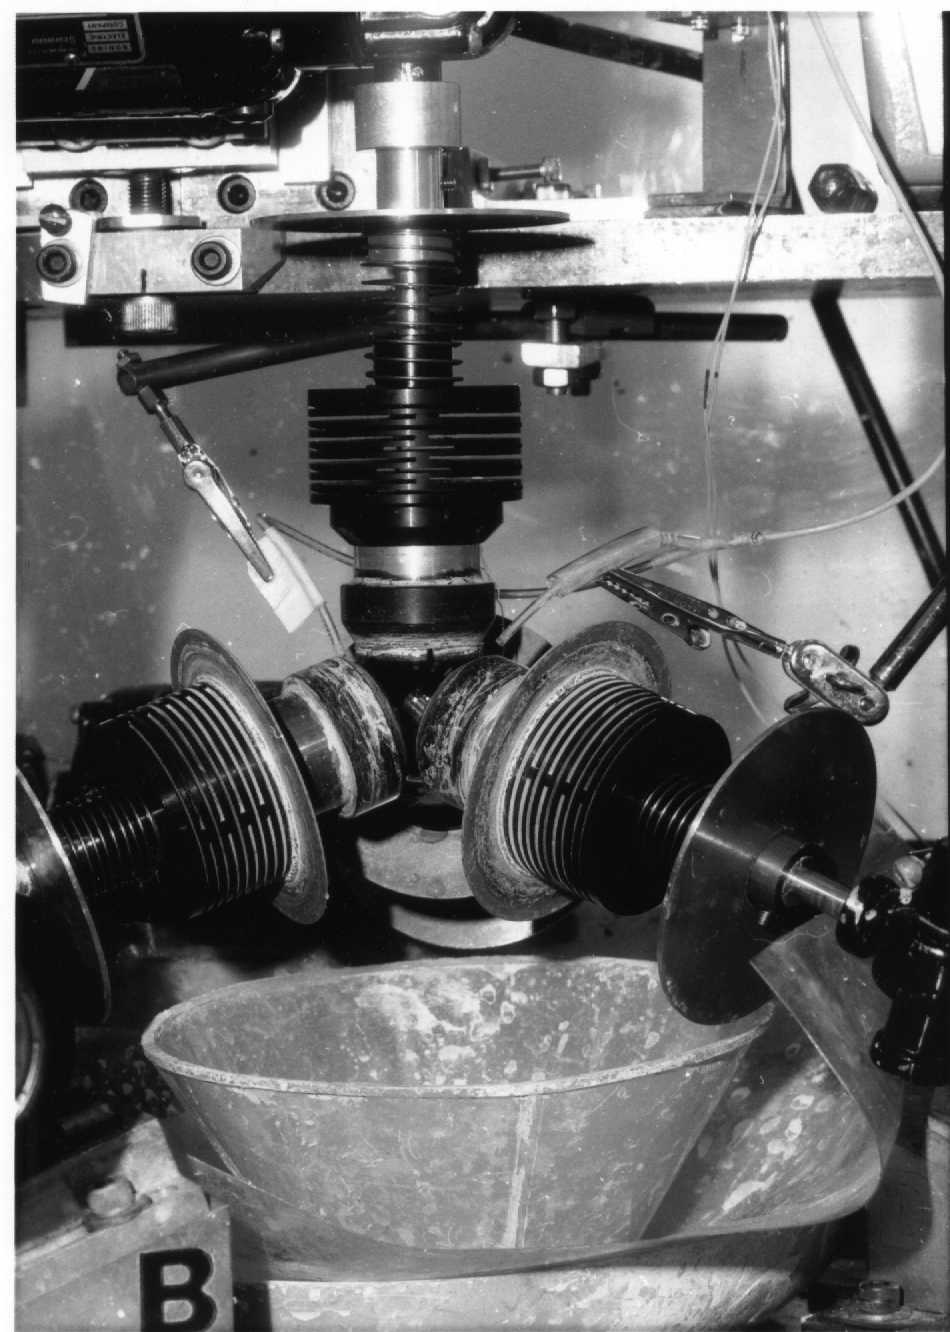
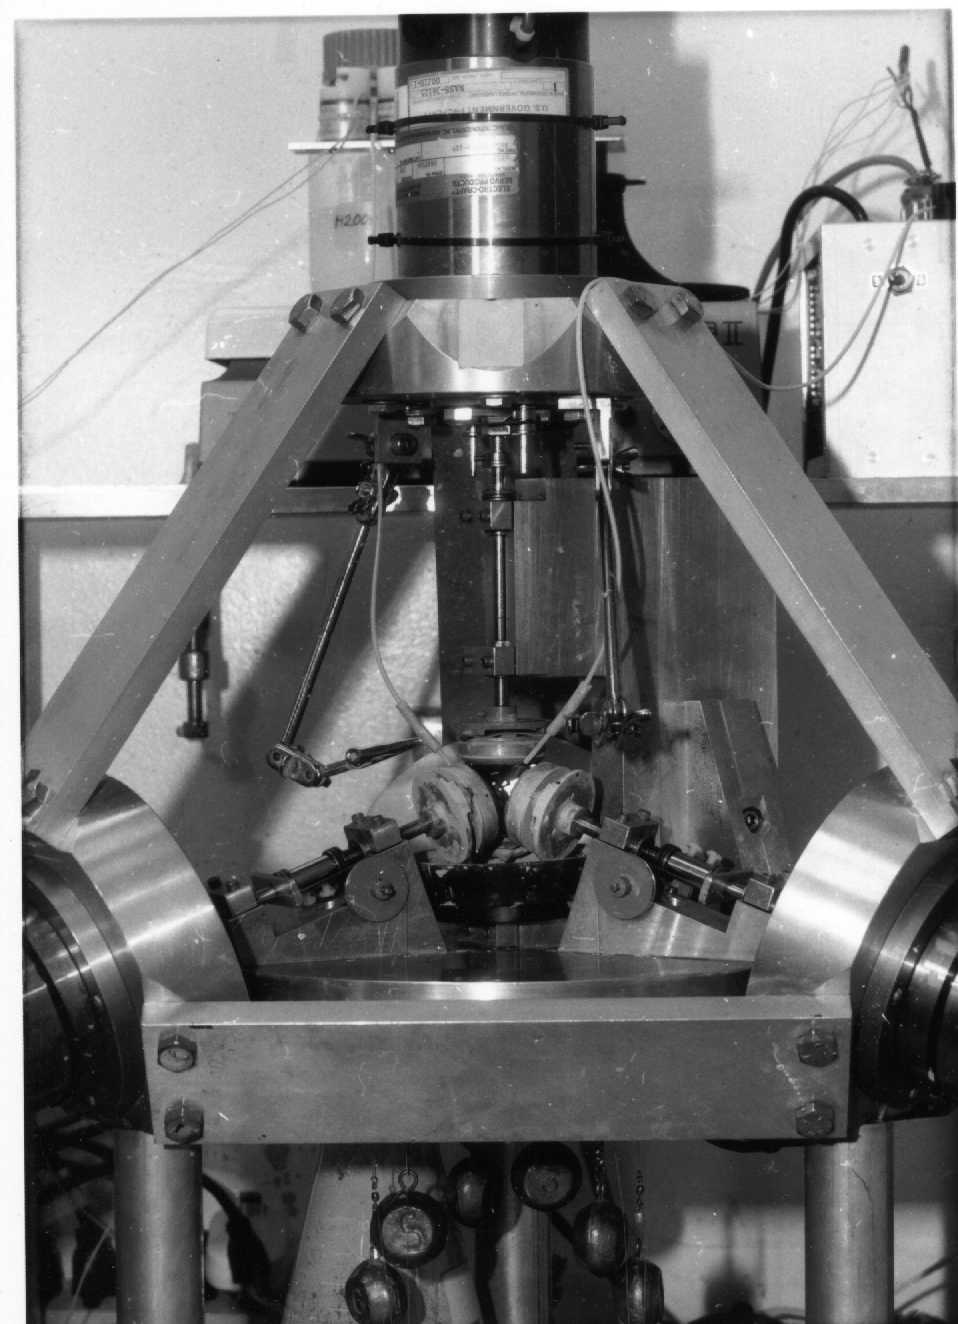
Fig. 1____
Close up view of the Angele - Ed White
"old" polishing machine (click on the image to enlarge)
Precision Spheres for Gravity Probe B Experiment (GP-B)
Frane Marcelja, George M. Keiser
Stanford University, Hansen Experimental Physics Laboratory
Gravity Probe B
Abstract: Spherical gyroscope rotors for a fundamental experiment in General Relativity were manufactured out of fused silica and single crystal silicon. We describe the manufacturing process and the associated measurements.
Introduction.
The General Theory of Relativity predicts two effects which should contribute to the drift of a perfect gyroscope in a polar orbit around the earth: a geodetic effect and a frame dragging. For a gyroscope in the form of a perfectly homogeneous sphere and for an orbit of 650 km altitude, the predicted drift rates are 6.6 arc sec per year for the geodetic effect and 0.042 arc sec per year for the frame dragging; Schiff, L.I.(ref.1). The aim of the Gravity Probe B experiment is to detect and measure these two effects to an accuracy better than 0.0005 arc sec per year.
However, imperfections of the gyroscope rotor spheres such as asphericity and inhomogeneity also cause drifts due to classical torques. It is therefore essential that these unwanted drifts be small compared to the effects to be measured. From an analysis of the electrical torques on the rotors it was determined that in order to reduce the drift rate due to asphericity to less than 0.0001 arc sec per year, the rotor spheres have to be polished to 1 micro inch (25 nm) or to deviate no more than ± 0.5 micro inch (12 nm) from a perfect sphere. Similar requirements are also set for the niobium thin film coating which is subsequently applied to the rotor spheres, because a non uniform coating can cause mass unbalance. Problems associated with the coating are discussed by Gill, D. et al. (ref.2).
The spheres were manufactured at the Hansen Experimental Physics Laboratory out of fused silica and out of single crystal silicon. Both materials are well established and have extensive industrial use.
Fused silica was originally chosen for the rotors because it is available with highly homogeneous density, which can be tested by measuring the uniformity of the index of refraction. Homosil fused silica (ref. 3) was tested and selected for homogeneity by the manufacturer using interferometry. Multipath refractive index measurements in three perpendicular directions, performed at the Physics Dept. of the Univ. of Aberdeen, confirmed the manufacturer results; De Freitas, J.M. et al. (ref.4).
On the other hand single crystal silicon has several desirable properties. Float zone refined single crystal silicon has 1 ppm typical homogeneity, which is an order of magnitude better than our requirement. In comparison to fused silica, silicon has smaller thermal expansion coefficient (4·10-8 K-1 at 2 deg. K) and higher thermal conductivity (?*) [but lower specific heat (?*)]. Therefore, an effort was made to manufacture silicon spheres of a similar precision as the fused silica spheres. The Wacker company was selected as a silicon supplier (ref.5).
The present plan is to use two gyroscope rotors spheres made of fused silica and two made of single crystal silicon. This paper will describe the manufacturing of such spheres and the related precision measurements.
We will first describe the specially developed machines and the methods of fabrication as well as the precision instrumentation, measurement methods and data analysis. This is followed by the discussion of lapping and polishing process. We conclude with the results obtained.
Experimental background, equipment and fabrication methods
Fabrication of the Gyroscope Rotor Spheres.
Angele developed the original lapping and polishing machines and described the manufacturing method (see Fig.1 and ref.6). The original lapping and polishing machines were built by Ed White at the Marshal Space Flight Center and transferred to Stanford University in 1970. The machines have tetrahedral symmetry: the axes of the laps coincide with the axes of a regular tetrahedron. All the first experimental rotors were manufactured using these machines. Later, a new polishing machine was designed and built at Stanford University (see ref.7 and Fig. 2). Both polishing machines were later modified and used in manufacturing the science mission rotors. To achieve the most uniform action, Angele selected the following six motions of the polishing laps (cycles):
cycles:
| 1 | 2 | 3 | 4 | 5 | 6 | 1 | 2 | |
| A (upper) lap | F | B | F | B | F | B | ||
| B (left) lap | B | F | B | F | F | B | ||
| C (back) lap | B | F | F | B | B | F | ||
| D (right) lap | F | B | B | F | B | F |
Table 1.
F=forward, B=backward
The motors of the original machine were equipped with analog speed controllers, augmented by digital controllers with tachometer feedback, to assure further uniformity, (ref.8) . The new Stanford machine is computer controlled. The rotation angle of each axis is controlled by means of servo motors and shaft position encoders (ref.9).
During the process, the sphere is supported by the laps. Due to the weight of the sphere (and given the symmetrical configuration) the pressure of the upper lap is smaller than the pressure of the lower laps, which support the weight of the sphere. As shown in Fig.3 the laps are annular calottes closely conforming to the sphere. During the process, the sphere slowly decreases in size and the shape of the laps adjusts accordingly. Therefore one can not arbitrarily switch spheres during the polishing process unless they are of the same size.
All this applies to both lapping and polishing machines, which have very similar general configuration. They differ however in many small details. In the following the emphasis will be on polishing, which is the most demanding process.
During the polishing process the sphere slowly rotates as a result of the combined action of all four laps (see note 10). The direction of the sphere rotation corresponds to the vector sum of the rotations transmitted from each of the four laps to the sphere (the lower three being equal and the upper one somewhat smaller due to the smaller pressure). The axis of rotation of the sphere points slightly downward between each pair of lower laps, depending on the cycle. Since the sphere rotates during polishing, it exerts net reaction torques upon the laps. As the laps are supprted by an elastic structure or a pivoted arm, these torques tend to induce larger pressure on the side of the lap where the sphere moves toward the lap. Therefore by using the lap mounts with a pivot close to the sphere, rather than a longer arm, we obtained an improvement of sphericity.
One of the most critical parameters determining the quality of the manufactured spheres was found to be the machine alignment. The construction of the original machine was such that the alignment was not easy and it tended to change, requiring periodic adjustment. Thus the new Stanford Machine was designed with the alignment problem in mind. A hole in the center of the base plate allows the insertion of a precision shaft bound to the vertical structure serving as the reference axis. Therefore the common intersection point of the vertical shaft with the lower laps shafts can be easily checked.
Another important parameter is the balance between the pressures exerted by the four laps on the sphere. The original machine uses specially made springs. The springs used for lower three laps are selected for a similar force at the working compression level and the forces are equalized by using adjustable back planes for the springs. For the new machine, only weights and pulleys were originally used. These were easy to equalize, but the central position of the sphere was unstable. After adding weak stabilizing springs the motion was quite stable and uniform.
As mentioned above, the new Stanford machine is controlled
by computer. It uses a commercial control system (see ref.9).
The control was such that the laps move in time through a periodic sequence
of angular positions. We suspected that this could lead to repeating polishing
patterns. We developed a model where the position of the instantaneous
axis of rotation of the sphere was followed in a coordinate system fixed
within the sphere (see Fig.7). Under some conditions
the model showed repetitive patterns, rather than a uniform random distribution.
We then introduced a slight random variation in the duration of the cycles
and used random permutations in the cycle sequence to avoid such repetition.
This improved the sphericity and lowered the reject rate.
Measurements and error corrections
Diameter Measurements
Because of a 0.001 inch (25 mm) gap in the suspension of the sphere in the gyroscope, the diameter tolerance did not need to be better than ± 20 micro inch (0.5 mm). For production purposes a relative diameter measurement with respect to a standard fused silica sphere was performed by using a specially constructed instrument (made by students in the Precision Engineering class, (ref.11 ). The instrument uses an LVDT (Linear Variable Differential Transducer) displacement sensor with a minimum scale division of 5 micro inch (127 nm), adequate for the specification. For the silicon spheres, corrections were made for the difference in thermal expansion coefficient between silicon and fused silica. The temperature was measured to a few tenths of degree C. Absolute measurements of the standard fused silica sphere were also performed as a project of the Precision Engineering student class, (ref.12 ). For this purpose students built an apparatus which is used in conjunction with an interferometer donated by the Hewlett Packard company. The size of the standard sphere was found to be 1.4959" ± 45 micro inch (37.996 ± 0.001 mm). The error is the geometric sum of statistical and estimated systematic errors.
Sphericity Measurements
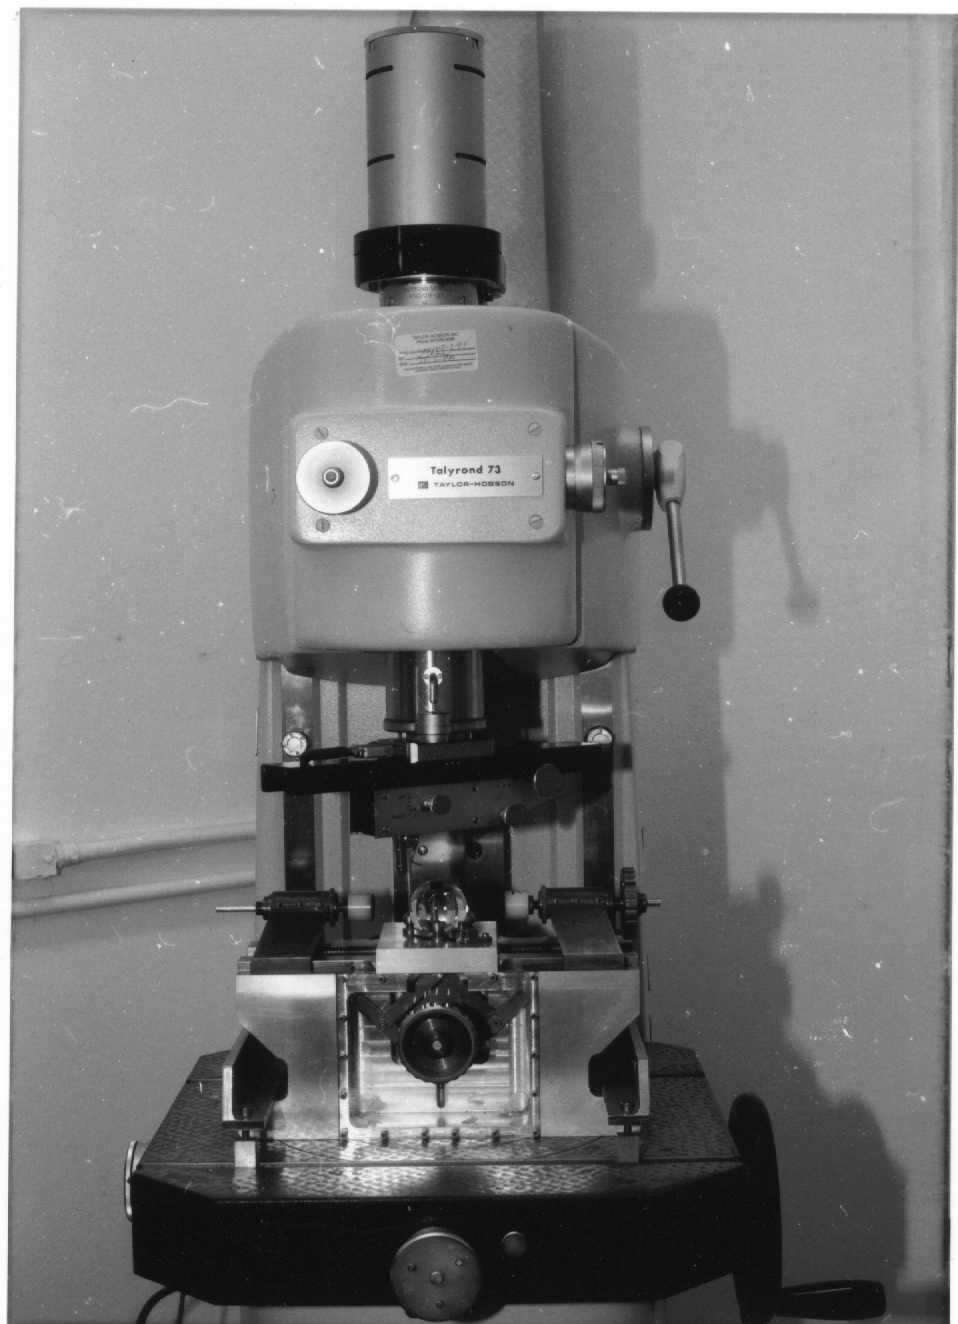
Measurements of sphericity were performed using a Talyrond roundness measuring instrument manufactured by the Rank Taylor Hobson Company (Fig.5 ). The main component of the instrument is a precision spindle, driven by a synchronous motor. Measurements were performed at the slow speed of 6 revolutions per minute. The spindle carries a rail, on which a displacement measuring instrument (LVDT) is mounted. During the measurement, the tip of the stylus is brought in contact with the sphere at a low force of 2-3 g. The tip of the stylus is made out of diamond for low friction and has a radius of about 9 mil (0.22 mm). The instrument has a good provision for precision centering. The resulting centering error (as determined by a least squares fit for each measurement) was of the order of 0.1 micro-inch (2.5 nm). The instrument is equipped with an analog amplifier and an active band pass filter. Usually the filter cutoff was set at 150 undulations per revolution and the amplification at 20,000 times.
The precision spindle upper bearing is conical and the lower one is semi-spherical, both floating on a thin oil film. Deviation of the spindle motion from pure rotation causes a measurement error which is a function of the rotation angle and reaches about 1 micro inch. As the motion of the spindle is quite repeatable over long periods of time, this error (Fig.6 ) can be subtracted from the measurements.
The sphere to be measured is supported by three small spheres. A thin kapton foil is inserted between the supports and the sphere, so as to avoid scratching the sphere. The incomplete rigidity of sphere support contributes slightly to the measurement errors. We estimate this contribution to be less then 0.1 micro inch (<2.5 nm)
Mechanical and electrical drifts also contribute to the measurement errors. The mechanical drifts are mainly due to temperature changes and appear as relaxations. Electrical drifts tend to be of more continuous nature. Usually 2 or 3 measurements are taken in a sequence and averaged. If the drift exceeds 0.1 micro inch (2.5 nm) the measurement is rejected.
Determination of Talyrond spindle error
The largest correction to the measurements was the subtraction of the Talyrond spindle error. This error was determined using the following methods:
Averaging method: One can measure the same great circle, in a series of rotated positions of the sphere. When taking the average of such measurements for a very good sphere, deviations from a perfect circle tend to average out, and spindle error (always the same in all measurements) can be determined. This method was used to check error correction obtained by other methods, as the corrected consecutive measurements should average very close to a circle. As an example, for a Talyrond error of 1 micro inch ( 25 nm) peak to valley (p/v), and a sphere error of 0.5 micro inch (12.5 nm) p/v, the error of the average of 12 or 15 measurements in a series of rotated positions, could be 0.1 micro inch (2.5 nm). The method is straightforward and does not require manipulation of the instrument.
Inversion method: The inversion method, (see Lipa, J. and Siddall, G.J., ref.13 ), takes advantage of the Talyrond instrument design, which allows the insertion of the displacement measuring assembly from either side of the rail connected to the spindle. After rotating the sphere 180 degrees around the z-axis and inverting the arm, one can measure the same point of the sphere again but with the opposite spindle error. By subtracting the two measurements one obtains twice the spindle error.
Fourier method: In this method the data is taken in the same way as
in the method of averaging, say 15 consecutive rotated positions. The data
is analyzed using a Fourier series expansion in order to detect and separate
the component which rotates with the sphere (sphere error) from the component
which is stationary (spindle error) (see DiDonna, B., ref.14
).
For our apparatus, the spindle error was found to be about 1.1 micro inch (28 nm) maximum, (see Fig 6 .)
Data acquisition and processing
The analog displacement signal is amplified, filtered and sampled synchronously with the spindle rotation. It is then converted into a digital signal in a Lawson 12 bit A/D converter. Sampling is done for 600 points per circle corresponding to a ~128 samples per linear inch (50 samples per cm). The start and stop signals for sampling are obtained from a micro switch which is actuated by a small cam on the spindle, corresponding with the stylus at the north pole position. Sixteen meridian circles are measured. After each measurement the sphere is rotated by 180/16 degrees. The equator is then measured as well.
Software for Reconstruction of the Sphere shape and study of sphericity.
The original software was developed under the guidance of Prof. J.Turneaure and written by Stanford University students. It was further modified to improve the display and allow easier measurement of a sequence of 17 circles (see ref.15).
The reconstruction can be broken into the following steps. For each meridian great circle, 2-3 measurements of 600 data points are taken, corrected for spindle error and stored in separate measurement files. Averages of consecutive measurements of the same circle are centered using least squares. Each circle is re-aligned and the standard deviations at the poles and the equator are checked. Two meridians are formed from the single great circle measurement by inverting the second half of the sequence. The data is stored, (32 data points for each parallel for 126 parallels and two poles). Next, the sphere is represented by an expansion in spherical harmonics, Y(l,m,J,j). The integration is performed for each l and m: j angle first, using trigonometric functions and J angle next, using associated Legendre functions up to Lmax=16. The result is a set of coefficients representing the sphere. The expansion is later used for calculating global peak to valley deviations from the ideal sphere and for plots. The coefficients are also used for the study of the gyroscope motion.
Fabrication of the spheres from bulk material
Fused silica spheres were manufactured from 2.5" Homosil cubes by two companies: Davidson Optronics and Speedring (ref.16). Both used a similar process consisting in a diamond turning, followed by grinding with rough abrasive (silicon carbide, 50 mm average size). The silicon spheres were manufactured at the Ginzton Laboratory Crystal Shop, Stanford University, from 2"(5cm) boules, using a similar approach.
Lapping and Polishing
We have discussed the mechanical problems first because one would like to have this part under control before attempting to optimize the process. Our application was such that the surface quality was of concern mostly insofar as it affects the sphericity. Subsurface damage (visible and not) was important because it modifies the properties of the bulk material in a surface layer which is estimated to be about twice as thick as the abrasive size used (10 mm and 3 mm for lapping; 1 mm for polishing). The surface was checked at a magnification 500 times, using a good optical microscope equipped with interference contrast attachment (Reichart). Additionally, an Atomic Force Microscope was used for some observations made by Dr. V.Graham (see ref.19; both microscopes courtesy of the Materials Research Laboratory, Stanford University).
In the lapping process our main concern was to remove all damaged material from the previous steps. The thickness of this damaged layer was expected to be 0.004" (100 mm). In fact as the size of the sphere at the acceptance was 1.55 inch (39.4 mm) and the final size was 1.4959" (~38 mm), the thickness of the layer removed by lapping and polishing was over six times the estimated thickness of the layer damaged in the grinding process. Brass laps with 6 cuts were used. Abrasive slurry was made by mixing alumina powder with de-ionized water. It was held in suspension by continuous stirring. Small amounts of slurry were pumped and delivered in drops. The slurry was not recirculated and was used at rate of about 1/4 liter per hour. We used abrasive of average size 10mm (Microgrit, ref. 17) for the removal of the first .025" (.635mm) of material. This stage lasted about 15 h for fused silica and about 30h for silicon. Lapping of the remaining .002" (51mm) was done using abrasive of average size 3mm (Microgrit). When a diameter of 1.4965" (38mm) was reached, the spheres were checked, measured and transferred to polishing. At this point the typical sphericity was 5-10 micro inch (130-250 nm)p/v. The estimated thickness of the damaged layer produced by lapping with 3mm abrasive was 6mm (0.0002), while the layer removed in polishing was 8mm (0.0003).
Two of the most important factors in determining the quality of the
polishing are the choice of slurry and the selection of the material used
in forming the laps. This is especially true for silicon spheres.
As polishing slurry we used commercial products: Big C (ceria slurry
from Universal Photonics, (ref.18a), H2000 (rare
earths proprietary slurry from Selectox - Hastings, ref 18b)
and/or fine grade alumina powders in deionized water (Baikalox, ref.18c).
Some of the products tested contained a considerable amount of very large particles (up to 40 mm particles in a nominally "1mm" powder,( see Fig 8 ). These are hard to separate and cause scratches, particularly in silicon. Scratches affect the sphericity, as the material around the scratch is modified and doesn't polish uniformly. Such scratches, even if polished out, leave irregular traces on the surface. We therefore looked for slurries which did not have such large particles. One way to find if big particles are present in a slurry is by washing off small particles. One eventually ends up with the larger residual particles which can be easily measured under a microscope (see Fig.8 ). In this way we were able to characterize several commercial products. The slurries finally selected still had a fraction of larger particles present, but in lesser degree.
We found that matching lap material, slurry and sphere material is the key to obtaining a good surface as well as a good sphericity. We started off using the original polishing machine equipped with specially made phenolic laps sintered with paper. In fused silica, these laps produced good sphericity, but not the best surface quality. Switching to pitch laps (Gugolz 64 from Universal Photonics ref.18a) produced a better surface, but not the best sphericity. This was traced to mechanical problems: When the polishing machines were modified , as described above, good sphericity could be obtained also with pitch laps.
Polishing of silicon presents additional problems, which are related to the crystalline structure of silicon (ref. 20). The experience gained in polishing fused silica was very useful when we started polishing silicon. The anisotropic mechanical and chemical properties of single crystal silicon are used to advantage when polishing flat silicon wafers. However, when the same polishing technology was attempted on a silicon sphere, it produced peak to valley heights of the order of 100 micro-inches (2.5 mm) highlighting the crystalline structure. Commercial products for polishing silicon wafers contain KOH, which is a preferential etcher. After reformulating the process and by using appropriate abrasive slurries and process controls, as described below, we were able to reduce the peak to valley heights to below 1 micro-inch globally.
The required sphericity and surface quality was achieved with a special combination of lap material and slurry, as well as a close control of the slurry acidity. The inadequate surface quality obtained on silicon with phenolic laps prompted us to return to pitch laps. Empirically, it was finally possible to identify a combination of factors which produced a particular condition on the silicon surface, leading in turn to a uniform polishing action. The best results were obtained when the pH was 6.7 and the surface wetting was minimal, which apparently minimizes chemical action. With the pitch laps there was less tendency to wet the silicon surface; in fact, the film of slurry would break up and it was necessary to deliver the slurry to each lap separately in order to guarantee that each lap was always wet.
Results and Conclusion:
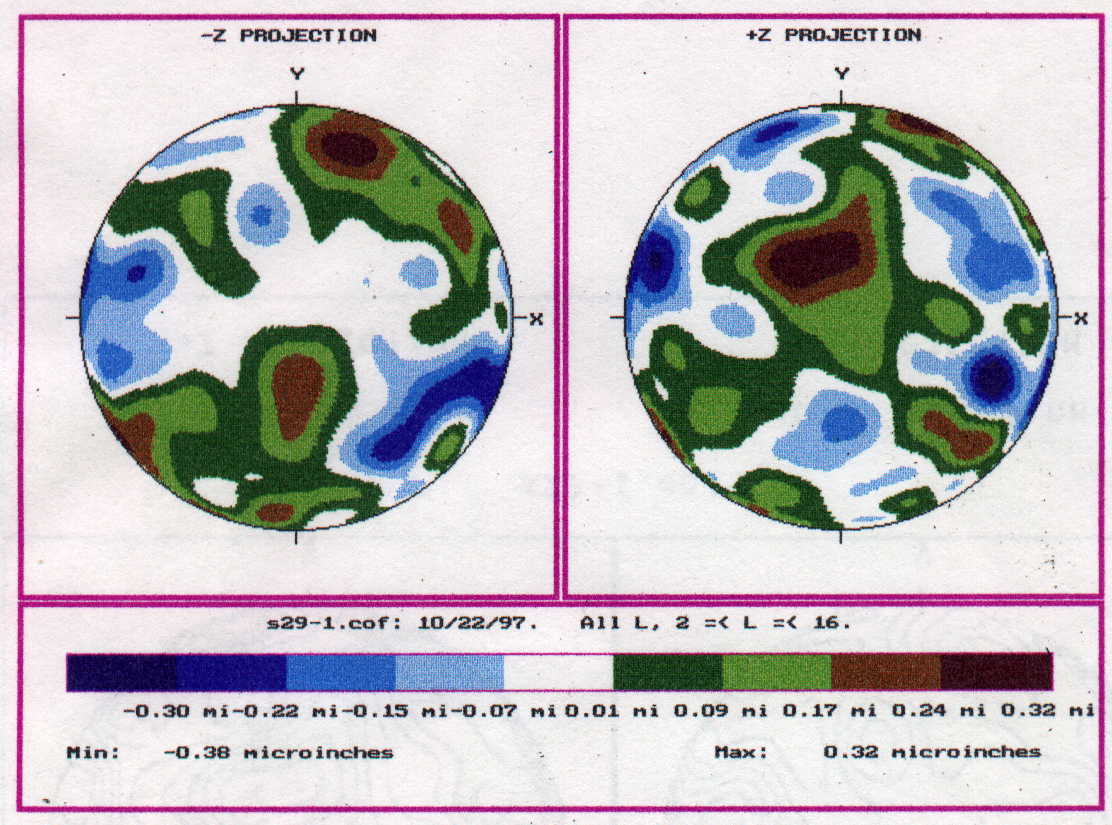
We manufactured gyroscope rotors in both fused silica and single crystal silicon. The rotors deviated from the perfect sphere by less then 1 micro inch (25 nm) peak to valley. The shape of the rotors was measured and represented by an expansion in spherical harmonics (see Fig. 9) To study the effects of the shape on the motion of the gyroscope one also uses spherical harmonics. Based on the requirements of the experiment, it is possible to establish specifications for the spherical harmonics coefficients and the coefficients obtained from the rotor measurements had to satisfy these specifications. The maximum peak to valley height for the L=2 component was specified to be less than 1 micro inch (25 nm), and for higher values of L, either L even (4£L£16 ) or odd (3£L£15), less than 0.7 micro inch (~18 nm).
It was found that for silicon spheres the crystalline structure contributes mostly to the L=4 harmonic and therefore this was the most difficult specification to satisfy. The best results obtained for the sum of the deviations due to the even harmonics L>2 were 0.3 to 0.4 micro inch (8 to 10 nm). Somewhat better results were obtained for the sum of the deviations due to the odd harmonics, which were typically 0.3 micro-inch (8 nm). This includes approximately 0.1 micro inch (2.5 nm) of residual uncorrected spindle error. For L=2 the peak to valley height was typically less then 0.5 micro inch (12nm). For overall sphericity, the best results were 0.6 to 0.7 micro-inch (15 to 18 nm).
Twelve fused silica spheres and eight silicon spheres were fabricated, satisfying all the requirements for the experiment. After extensive testing of all completed gyroscope spheres, two silicon and two fused silica gyroscope spheres were selected for the scientific mission.
There are other applications where spheres of similar precision are
needed. Examples include silicon spheres for a precise determination of
Avogadro's number and one kilogram silicon spheres to replace the present
weight standard (see ref.21) We expect that the
experience gained in this work will also prove useful in other applications.
Acknowledgements
From Angele's work to the time the spheres for the relativity mission
were ready, many people contributed to the effort. We would like to thank
all of them, but some should be mentioned by name. Prof. J. Turneaure was
a leader in the experiment and much involved in the early days when the
laboratory and the project were established. Several students worked under
his guidance in developing measurements and analysis software (ref.15).
Prof. D.DeBra was always at hand and his Precision Engineering class students,
year after year made substantial contributions. Dr. De yu Pan was involved
in setting up, performing and analyzing the first measurements. Engineer
Ted Ale contribured many designs which were instrumental for the success.
Mr. T. Van Hooydonk produced very good fused silica spheres using the original
polishing machines. Two graduate students C.Willish and M.Bleckmann (ref.22)
and one undergraduate student B.DiDonna (ref.14) completed
their theses while working in the laboratory. Student D.Schwartz wrote
program which runs Stanford polishing machine.
Fig. 1____
Close up view of the Angele - Ed White
"old" polishing machine (click on the image to enlarge)
Fig. 2____
View of the "new" Stanford polishing machine
after modification (click on the image to enlarge).
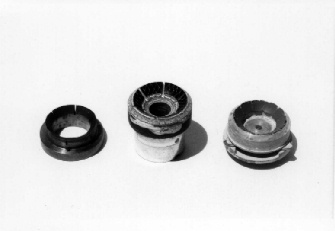
Fig. 3____
Three types of laps.
L to R: brass lap, phenolic lap for the old machine and pitch lap
for the new machine, (click on the image to enlarge).
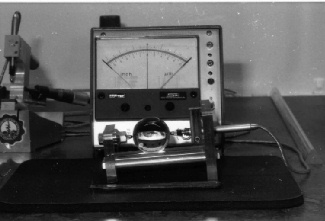
Fig. 4____
Instrument for measurement of a sphere diameter, (click on the image
to enlarge).
Fig. 5____ Talyrond measuring machine, (click on the image to
enlarge).

Fig. 6____
Talyrond spindle eror. Peak to valley is about 1 micro inch (25 nm)

Fig. 7____
Simulation of the movement of a rotation axis during the polishing
Fig. 8____
Large abrasive particles separated from a 1 micrometer commercial slurry
product.
Fig. 9____
Silicon sphere s29 stil shows a hint of crystalline structure, (click
on the image to enlarge).
1 Schiff,L.I.: Possible New Experimental
Test of General Relativity Theory.
PRL 4(1960)215-17.
2 Gill, D. et al.: Requirements and an
Approach for Coating the Gravity Probe B Gyroscope Rotor.
Surface and Coatings Technology, 36(1988)471-8.
3 Heraeus - Amersil: Quartz Glass for
Optics, Data and Properties, gives for Homosil: bubble class 0, striae
grade A , change in index of refraction across 150 mm less than 1
ppm, residual strain < 5 nm/cm, OH content ~200 ppm.
4 De Freitas, J.M. and M.A.Player: Ultrahigh
precision measurements of optical heterogeneity of high quality fused silica.
Applied Physics Letters 66(1995)3552-4.
5 Wacker , product description., monocrystalline
silicon. N-type Phosphorus, Oxigen content 1016 At cm-3
Carbon
content ~2 1016 At cm-3.
Dopant radial variation: 10% for <111>
orientation.
6 Angele, W.:Finishing high precision
quartz balls.
Precision Engineering 2(1980)119-22.
7 Lindbergh, E. - DeBra, D., private communication.
8 Minarik Electric,
321 E. Boyd St., Los Angeles, CA 90013.
9 PC-DSP Motion Controller, Motion Engineering,
520 E. Montecito St., Santa Barbara, CA
93103.
10 note: in another type of machine, described in: Polishing a 1- kg silicon sphere fora density standard, by A.Leistner and G. Zossi in Applied Optics Vol.26 No.4 (1987) and used in ref.: A. J. Leistner: Fabrication of 1 KG Single Crystal Silicon Super-precision Spheres (Balls) for the Avogadro's Experiment, Proceedings of Silicon Machining 1998 Spring Topical Meeting, ASPE (American Society of Precision Engineering) pg. 101-4, sphere has to be moved by hand (private communication).
11 The device was designed and constructed by students in Precision Engineering class under the guidance of Prof. D.DeBra.
12 Precision Engineering class students, under the guidance of Prof. D.DeBra designed and constructed the device and measured the sphere absolute diameter. This was reported, but never published. The participating students were D. Barksdale, G.Chaterjee and L. Chavez.
13 Lipa, J. and Siddall G.J.: High Precision
Measurement of Gyro Rotor Sphericity
Precision Engineering 2(3).
14 DiDonna, B. : Suspension Torque Predictions
for Relativity Gyroscope Experiment.
Undergraduate Honors Thesis,
Dept. of Physics, Stanford University.
15 Several students participated in development
of measurement and analysis programs. The programs are written in Pascal
language. The original program was written under the guidance of
Prof. J. Turneaure by R.Hofmann. Later A.Stoica and G. Chang worked on
the version which was used for several years. Finally M.Rozler and Chizhevsky
brought the program in present state.
16 Davidson Optronics, 2223 Ramona Boul.,
West Covina, CA 91790
Speedring, 6717 AlL Hwy 157,
Cullman, AL 35056-1588.
17 Micro Abrasives Corporation,
720 Southhampton Road, Westfield
MA 01086.
18 a) Universal Photonics Inc.,
495
West John St., Hicksville, NY 11801.
b) Selective Particle Technology,
46 Herrontown
Circle, Princeton, NJ 08540.
c) Baikalox Baikowski International
Corp.,
1833-B
Crossbeam Dr. Charlotte, NC 28217.
a) Investigation of Gyro Rotor Surface Quality during
Manufacturing,
GP-B Internal Report, Stanford Univ.
1991.
b) Manufacture of Ultra-Precision Spherical Rotors for
Gravity Probe B Gyroscopes,
GP-B Internal Report, Stanford Univ.
1992.
c) Investigation into Sphericity and Surface Quality of
Fused Silica Gyro Rotors
GP-B Internal Report, Stanford Univ.
1993.
20 Marcelja F., Keiser,
G.M.: Silicon Spheres for Gravity Probe B Experiment,
Proc. of ASPE Spring Topical
Meeting on Silicon Machining pg. 74-6, 1998.
21 Metrologia, Vol. 31 numb. 3 Nov. 1994, International Workshop on the Avogadro Constant and the Representation of Silica Mole
22 C.Willsch: Diplomarbeit, Aachen 1992; M.Bleckmann: Diplomarbeit, Aachen 1993.
![[]](Particle.jpg)